ZEC/USD has tested the resistance area at $366 yesterday but bulls were unable to break it through and the price went downwards. Zcash is also close to the higher border of the Ichimoku cloud and it is testing it currently. The currency pair forms a big ascending triangle here.
The possible scenarios for ZEC/USD are the following:
1. The currency pair will jump off the ascending trend line, which coincides with the higher border of the Ichimoku cloud and go towards the resistance area at $366. ZEC/USD will test the resistance there.
2. Zcash will break through the ascending trend line and the higher border of the Ichimoku cloud and move towards the next support area at $325.
3. The currency pair will stay close to the current levels or rally slightly along the ascending trend line.
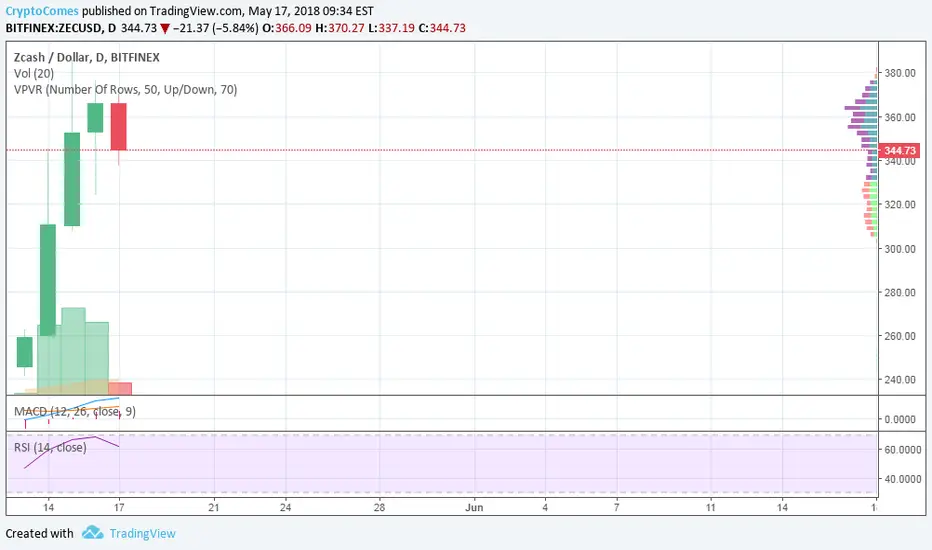
ZEC/USD fluctuates above the midterm ascending trend line on the daily chart but seems to start a correction in the nearest future. The closest midterm target for the correction is the support area at $307. Otherwise, ZEC/USD will follow the upside tendency.
Check the full crypto analysis HERE
The possible scenarios for ZEC/USD are the following:
1. The currency pair will jump off the ascending trend line, which coincides with the higher border of the Ichimoku cloud and go towards the resistance area at $366. ZEC/USD will test the resistance there.
2. Zcash will break through the ascending trend line and the higher border of the Ichimoku cloud and move towards the next support area at $325.
3. The currency pair will stay close to the current levels or rally slightly along the ascending trend line.
ZEC/USD fluctuates above the midterm ascending trend line on the daily chart but seems to start a correction in the nearest future. The closest midterm target for the correction is the support area at $307. Otherwise, ZEC/USD will follow the upside tendency.
Check the full crypto analysis HERE
免責聲明
這些資訊和出版物並不意味著也不構成TradingView提供或認可的金融、投資、交易或其他類型的意見或建議。請在使用條款閱讀更多資訊。