Us100
市場面臨全面降溫,美元強勢回歸,牛市的起點或是熊市的反彈?《煙花三月下揚州,滿園春色關不住》
一、 2月2日FOMC會議:政策放緩,市場大漲。
2月FOMC 會議落下帷幕。美聯儲進一步加息25基點,聯邦利率區間升至4.5%-4.75%,政策步伐進一步放緩。美聯儲主席鮑威爾在會後的新聞發佈會上的態度“明鷹暗鴿”,表明官員們正在討論何時將暫停加息。市場對此的反應卻非常積極,美股大漲,納斯達克指數在三大指數中領漲且一度反彈約2.7%,美元指數大幅回落。
2022年11 月份以來,全球風險偏好大幅升溫,資產價格出現逆轉,中國放棄“清零政策”帶來的樂觀情緒,同時美國通脹拐點的出現促使美聯儲加息步伐放緩。市場目前充分計價了當前加息的放緩和終結,甚至計入了CME FedWatch Tool對於市場年底有兩次降息的預期,因此對於當前的市場水準和重心而言,我們應重點關注終端利率的位置和美聯儲合適開啟降息。
根據過去十餘載的個人交易經驗歷史,若FOMC會議當天的市場價格反應劇烈,通常後市都難以延續甚至出現逆轉。
二、 2月3日非農報告:美國“火熱勞工市場”的隱憂,市場回檔。
1月新增非農就業人數51.7萬人,遠遠超過市場預期的18萬人,失業率進一步降至3.4%創50多年新低。具體從分行業資料觀察,服務業為這份靚麗報告做出了主要貢獻,休閒住宿增加12.8萬、商業服增加8.2萬、醫療服務增加5.8萬、零售增加3.0萬等。製造業增加1.9萬表明製造業仍在擴張,但速度明顯放緩。
火熱勞工市場導致通脹反復:
為何美聯儲持續的加息還能維持如此火熱的勞工市場?一個解釋是就業資料是滯後指標,美聯儲加息的影響還未充分傳達到勞工市場,尤其是對於利率不敏感的服務業。強勁的就業會增加社會總收入,可能導致通脹的反復。
服務業通脹在CPI中占比高達58.8%,故服務勞工市場的火熱將導致服務通脹擁有更強的粘性,這也是我們之前一直強調美國通脹可能反復的可能性,所以在當前市場樂觀預期年底降息兩次的情況下,我們卻維持相對謹慎的態度。
三、 結論。
當前的市場定價無論從估值或節奏來觀察都存在“預期搶跑”,港股市場的火熱逐漸冷卻下來,美股市場的前方迷霧重重,A股經濟修復的預期是否能持續還有待觀察。我們當然需要在2023保持相對樂觀,但是對於資產價格而言,保持耐心和理性可能是當下最重要的修行。火熱的一月市場已經過去,二月也許還存有餘溫,三月若有空閒不妨“下揚州”一趟,冬去春來,萬物新生。
us100, 10d+/9.74%上漲周期 大於10天 9.74%
rising cycle 9.74% more thna 10 days.
==================================================================================================================================================================
此數據為機器人分析。 根據亞當理論分析歷史趨勢(20移動平均線/60移動平均線/120移動平均線/240移動平均線),估計未來 10 天的趨勢。 白線為機器人預期價格,上下橫線為止損止盈價,無財務根據,結果僅供參考。
This data is analyzed by robots. Analyze historical trends based on The Adam Theory of Markets (20 moving averages/60 moving averages/120 moving averages/240 moving averages) and estimate the trend in the next 10 days. The white line is the robot's expected price, and the upper and lower horizontal line stop loss and stop profit prices have no financial basis. The results are for reference only.
US100, 10d+/12004~12879區間 大於10天 12004~12879
shaking at 12004~12879 more than 10 days.
==================================================================================================================================================================
此數據為機器人分析。 根據亞當理論分析歷史趨勢(20移動平均線/60移動平均線/120移動平均線/240移動平均線),估計未來 10 天的趨勢。 白線為機器人預期價格,上下橫線為止損止盈價,無財務根據,結果僅供參考。
This data is analyzed by robots. Analyze historical trends based on The Adam Theory of Markets (20 moving averages/60 moving averages/120 moving averages/240 moving averages) and estimate the trend in the next 10 days. The white line is the robot's expected price, and the upper and lower horizontal line stop loss and stop profit prices have no financial basis. The results are for reference only.
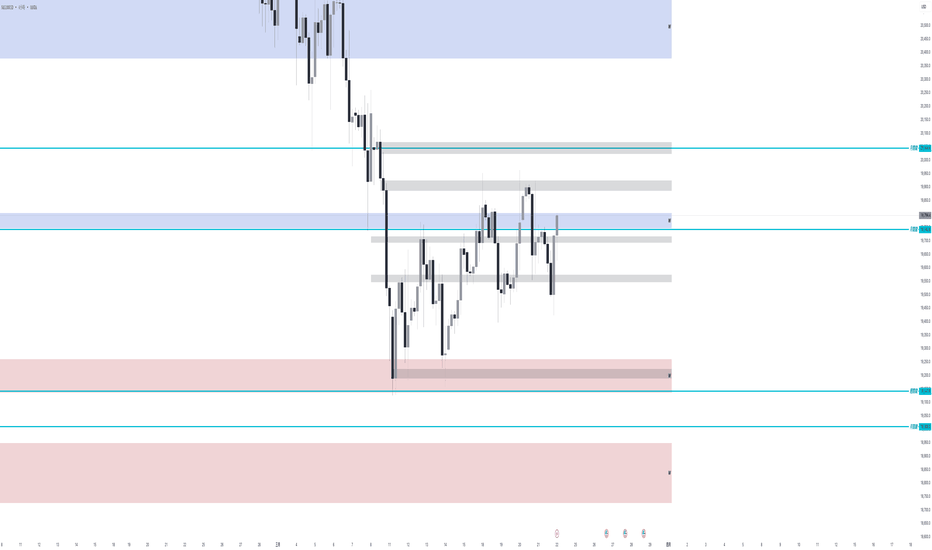
US100, 8d/-4.4%下降週期 8天 -4.4%
falling cycle -4.4% in days.
==================================================================================================================================================================
此數據為機器人分析。 根據亞當理論分析歷史趨勢(20移動平均線/60移動平均線/120移動平均線/240移動平均線),估計未來 10 天的趨勢。 白線為機器人預期價格,上下橫線為止損止盈價,無財務根據,結果僅供參考。
This data is analyzed by robots. Analyze historical trends based on The Adam Theory of Markets (20 moving averages/60 moving averages/120 moving averages/240 moving averages) and estimate the trend in the next 10 days. The white line is the robot's expected price, and the upper and lower horizontal line stop loss and stop profit prices have no financial basis. The results are for reference only.
US100, 10d+/-17.6%下降週期 大於10天 -17.6%
falling cycle -17.6% more than 10 days.
==================================================================================================================================================================
此數據為機器人分析。 根據亞當理論分析歷史趨勢(20移動平均線/60移動平均線/120移動平均線/240移動平均線),估計未來 10 天的趨勢。 白線為機器人預期價格,上下橫線為止損止盈價,無財務根據,結果僅供參考。
This data is analyzed by robots. Analyze historical trends based on The Adam Theory of Markets (20 moving averages/60 moving averages/120 moving averages/240 moving averages) and estimate the trend in the next 10 days. The white line is the robot's expected price, and the upper and lower horizontal line stop loss and stop profit prices have no financial basis. The results are for reference only.
US100, 9d/39.01%上升週期 9天 39.01%
rising cycle 39.01% in 9 days.
==================================================================================================================================================================
此數據為機器人分析。 根據亞當理論分析歷史趨勢(20移動平均線/60移動平均線/120移動平均線/240移動平均線),估計未來 10 天的趨勢。 白線為機器人預期價格,上下橫線為止損止盈價,無財務根據,結果僅供參考。
This data is analyzed by robots. Analyze historical trends based on The Adam Theory of Markets (20 moving averages/60 moving averages/120 moving averages/240 moving averages) and estimate the trend in the next 10 days. The white line is the robot's expected price, and the upper and lower horizontal line stop loss and stop profit prices have no financial basis. The results are for reference only.
US100, 8d/-11.23%下降週期 8天 -11.23%
falling cycle -11.23% in 8 days
==================================================================================================================================================================
此數據為機器人分析。 根據亞當理論分析歷史趨勢(20移動平均線/60移動平均線/120移動平均線/240移動平均線),估計未來 10 天的趨勢。 白線為機器人預期價格,上下橫線為止損止盈價,無財務根據,結果僅供參考。
This data is analyzed by robots. Analyze historical trends based on The Adam Theory of Markets (20 moving averages/60 moving averages/120 moving averages/240 moving averages) and estimate the trend in the next 10 days. The white line is the robot's expected price, and the upper and lower horizontal line stop loss and stop profit prices have no financial basis. The results are for reference only.
US100, 10d+/-20.05%下降週期 大於10天 -20.05%
falling cycle -20.05% more than 10 days.
==================================================================================================================================================================
此數據為機器人分析。 根據亞當理論分析歷史趨勢(20移動平均線/60移動平均線/120移動平均線/240移動平均線),估計未來 10 天的趨勢。 白線為機器人預期價格,上下橫線為止損止盈價,無財務根據,結果僅供參考。
This data is analyzed by robots. Analyze historical trends based on The Adam Theory of Markets (20 moving averages/60 moving averages/120 moving averages/240 moving averages) and estimate the trend in the next 10 days. The white line is the robot's expected price, and the upper and lower horizontal line stop loss and stop profit prices have no financial basis. The results are for reference only.
US100, 10d+/14.7%上升週期 大於10天 14.7%
rising cycle 14.7% more than 10 days.
==================================================================================================================================================================
此數據為機器人分析。 根據亞當理論分析歷史趨勢(20移動平均線/60移動平均線/120移動平均線/240移動平均線),估計未來 10 天的趨勢。 白線為機器人預期價格,上下橫線為止損止盈價,無財務根據,結果僅供參考。
This data is analyzed by robots. Analyze historical trends based on The Adam Theory of Markets (20 moving averages/60 moving averages/120 moving averages/240 moving averages) and estimate the trend in the next 10 days. The white line is the robot's expected price, and the upper and lower horizontal line stop loss and stop profit prices have no financial basis. The results are for reference only.
US100, 6d/-12.96%下降週期 6天 -12.96%
falling cycle -12.96% in 6 days.
==================================================================================================================================================================
此數據為機器人分析。 根據亞當理論分析歷史趨勢(20移動平均線/60移動平均線/120移動平均線/240移動平均線),估計未來 10 天的趨勢。 白線為機器人預期價格,上下橫線為止損止盈價,無財務根據,結果僅供參考。
This data is analyzed by robots. Analyze historical trends based on The Adam Theory of Markets (20 moving averages/60 moving averages/120 moving averages/240 moving averages) and estimate the trend in the next 10 days. The white line is the robot's expected price, and the upper and lower horizontal line stop loss and stop profit prices have no financial basis. The results are for reference only.
US100, 9d/-9.78%下降週期 9天 -9.78%
falling cycle -9.78% in 9 days.
==================================================================================================================================================================
此數據為機器人分析。 根據亞當理論分析歷史趨勢(20移動平均線/60移動平均線/120移動平均線/240移動平均線),估計未來 10 天的趨勢。 白線為機器人預期價格,上下橫線為止損止盈價,無財務根據,結果僅供參考。
This data is analyzed by robots. Analyze historical trends based on The Adam Theory of Markets (20 moving averages/60 moving averages/120 moving averages/240 moving averages) and estimate the trend in the next 10 days. The white line is the robot's expected price, and the upper and lower horizontal line stop loss and stop profit prices have no financial basis. The results are for reference only.
US100, 10d/-11.51%下降週期 大於10天 -11.51%
falling cycle -11.51% more than 10 days.
==================================================================================================================================================================
此數據為機器人分析。 根據亞當理論分析歷史趨勢(20移動平均線/60移動平均線/120移動平均線/240移動平均線),估計未來 10 天的趨勢。 白線為機器人預期價格,上下橫線為止損止盈價,無財務根據,結果僅供參考。
This data is analyzed by robots. Analyze historical trends based on The Adam Theory of Markets (20 moving averages/60 moving averages/120 moving averages/240 moving averages) and estimate the trend in the next 10 days. The white line is the robot's expected price, and the upper and lower horizontal line stop loss and stop profit prices have no financial basis. The results are for reference only.
烏、俄 開戰~行情大波動!烏、俄 今早宣佈開戰~
全球行情開啟大波動!
做趨勢策略的人大幅度盈利~
一直有在關注我的文章的~
可以來回顧一下佈局~
黃金、原油 大漲!
指數、加密貨幣 大跌!
US30 H4 在 02/14 亮起紫色燈號!
< 價位 34,651.3 佈局空單!>
現價 32,400.8 跌幅約 6.9 %!
OANDA:US30USD
US100 H4 在 02/14 亮起紫色燈號!
< 價位 14,257.2 佈局空單!>
現價 13,156.5 跌幅約 8.12 %
CURRENCYCOM:US100
S&p500 H4 在 02/14 亮起紫色燈號!
< 價位 4,370.4 佈局空單!>
現價 4,136 跌幅約 5.82 %
OANDA:SPX500USD
JP225 H4 在 02/15 亮起紫色燈號!
< 價位 27,044.8 佈局空單!>
現價 25,843.1 跌幅約 4.82 %
OANDA:JP225USD
BTCUSDT H4 在 02/18 亮起紫色燈號!
< 價位 40,665.81 佈局空單!>
現價 34,958.32 跌幅約 15.06 %
BINANCE:BTCUSDT
ETHUSDT H4 在 02/19 亮起紫色燈號!
< 價位 2,800.46 佈局空單!>
現價 2,390.22 跌幅約 16.04 %
BINANCE:ETHUSDT
XAUUSD H4 在 02/08 亮起藍色燈號!
< 價位 1,820.14 佈局多單!>
現價 1,939.6 漲幅約 6.94 %
OANDA:XAUUSD
WTIUSD D1 在 01/11 亮起藍色燈號!
< 價位 80.76 佈局多單!>
現價 95.71 漲幅約 24.3 %
FOREXCOM:WTIUSD
XBRUSD D1 在 01/11 亮起藍色燈號!
< 價位 80.87 佈局多單!>
現價 97.98 漲幅約 22.71 %
FXOPEN:XBRUSD
還想看什麼商品?
歡迎交流、體驗指標~
US100, 7d/-18.45%下降週期 7天 -18.45%
falling cycle -18.45% in 7 days.
==================================================================================================================================================================
此數據為機器人分析。 根據亞當理論分析歷史趨勢(20移動平均線/60移動平均線/120移動平均線/240移動平均線),估計未來 10 天的趨勢。 白線為機器人預期價格,上下橫線為止損止盈價,無財務根據,結果僅供參考。
This data is analyzed by robots. Analyze historical trends based on The Adam Theory of Markets (20 moving averages/60 moving averages/120 moving averages/240 moving averages) and estimate the trend in the next 10 days. The white line is the robot's expected price, and the upper and lower horizontal line stop loss and stop profit prices have no financial basis. The results are for reference only.
US100, 9d/5.9%上升週期 9天 5.9%
rising cycle 5.9% in 9 days.
==================================================================================================================================================================
此數據為機器人分析。 根據亞當理論分析歷史趨勢(20移動平均線/60移動平均線/120移動平均線/240移動平均線),估計未來 10 天的趨勢。 白線為機器人預期價格,上下橫線為止損止盈價,無財務根據,結果僅供參考。
This data is analyzed by robots. Analyze historical trends based on The Adam Theory of Markets (20 moving averages/60 moving averages/120 moving averages/240 moving averages) and estimate the trend in the next 10 days. The white line is the robot's expected price, and the upper and lower horizontal line stop loss and stop profit prices have no financial basis. The results are for reference only.
US30、NAS100、S&P500 美指系列檯子軟~FOMC 陸陸續續放消息,
股市、加密貨幣 全部收割了一波,
看著指標,
現貨逃的逃~
合約的用力做空~
倒是大賺一筆~
US30 在 01/10 亮起紫色燈號!
<<空頭訊號>>
到昨天最低點 33,150.4,
現價跌幅高達 8.56 %!
NAS100 在 01/06 亮起紫色燈號!
<<空頭訊號>>
到昨天最低點 13,721,
現價跌幅更高達 12.99 %!
S&P500 在 01/19 亮起紫色燈號!
<<空頭訊號>>
到昨天最低點 4,222,
現價跌幅高達 7.70 %!
單子目前都還在場上,
而且最近這幾天 D1 也陸續轉空!
大方向更是確立了,
但,需注意星期四 FOMC 利率公布!
可以設置保藍來防止突發行情。
OANDA:US30USD
CURRENCYCOM:US30
OANDA:NAS100USD
CAPITALCOM:US100
CURRENCYCOM:US500
OANDA:SPX500USD
US100, 9d/16.55%上升週期 9天 16.55%
rising cycle 16.55% in 9 days.
==================================================================================================================================================================
此數據為機器人分析。 根據亞當理論分析歷史趨勢(20移動平均線/60移動平均線/120移動平均線/240移動平均線),估計未來 10 天的趨勢。 白線為機器人預期價格,上下橫線為止損止盈價,無財務根據,結果僅供參考。
This data is analyzed by robots. Analyze historical trends based on The Adam Theory of Markets (20 moving averages/60 moving averages/120 moving averages/240 moving averages) and estimate the trend in the next 10 days. The white line is the robot's expected price, and the upper and lower horizontal line stop loss and stop profit prices have no financial basis. The results are for reference only.