This started as a personal arrays study, but after a few tests I decided to made a framework to get my own scripts simplest, lighter and faster.
And now I'm sharing with you guys.
Is very simple to use:
Feel free to use.
Hope brings some profits for you guys!!
And now I'm sharing with you guys.
Is very simple to use:
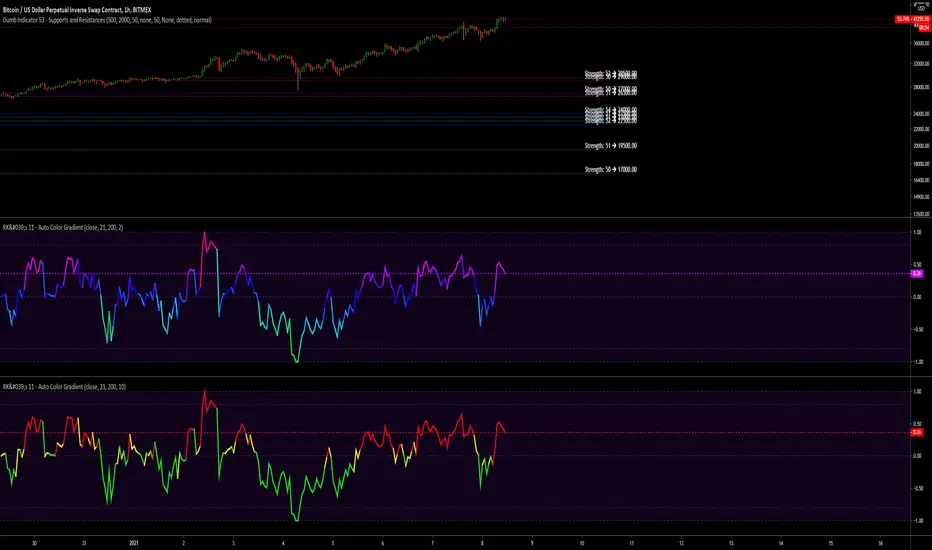
- Copy evething inside "RK's Auto Color Gradient Framework" block;
- Paste anywhere before the plotting;
- Declare the color variable name calling the function "f_autocolor(___, ___)" with the source you gonna plot and the size of the scale do you want to use to compare the data.
Feel free to use.
Hope brings some profits for you guys!!
發行說明
Version 1.1 notes:- Put the script link on the code;
- Now the choice of the theme is outside the function;
- I deleted the reverse input and put the explanation to how reverse the scale;
- And I wrote a simple text to help if anyone wants to add their own color scale gradient.
To change the direction of the gradient scale, just invert the math sign of the source with a simple (-).
發行說明
█ PATCH NOTES: Version 1.2- Better Instructions Comments;
- More themes;
- Adding new Gradient Scales is easier;
█ HOW TO USE THIS FRAMEWORK:
1 — Copy evething inside "RK's Auto Color Gradient Framework" block;
2 — Paste anywhere before the plotting;
3 — Declare the color variable name calling the function f_autocolor(series, scale_length, theme_number)
ARGUMENTS:
series (series) → Series of values (source) to process.
scale_length (integer) → Number of bars to measure the highest and lowest values
theme_number (integer) → Number of the theme
開源腳本
秉持TradingView一貫精神,這個腳本的創作者將其設為開源,以便交易者檢視並驗證其功能。向作者致敬!您可以免費使用此腳本,但請注意,重新發佈代碼需遵守我們的社群規範。
Feel free to share your success with me: 🤑👍
BTC - bc1qq23w655arvclce7u8zkt4lag08fnctgccs9s9s
ETH - 0xf6cf166Ea5EC550372e179dB1AF579a29Cb91dDf
USDT - 0x8DbC0E889Afb3bec7241eD0E42429A612aa30015 - (ERC20)
BTC - bc1qq23w655arvclce7u8zkt4lag08fnctgccs9s9s
ETH - 0xf6cf166Ea5EC550372e179dB1AF579a29Cb91dDf
USDT - 0x8DbC0E889Afb3bec7241eD0E42429A612aa30015 - (ERC20)
免責聲明
這些資訊和出版物並非旨在提供,也不構成TradingView提供或認可的任何形式的財務、投資、交易或其他類型的建議或推薦。請閱讀使用條款以了解更多資訊。