OPEN-SOURCE SCRIPT
已更新 Average Down [Zeiierman]
AVERAGING DOWN
Averaging down is an investment strategy that involves buying additional contracts of an asset when the price drops. This way, the investor increases the size of their position at discounted prices. The averaging down strategy is highly debated among traders and investors because it can either lead to huge losses or great returns. Nevertheless, averaging down is often used and favored by long-term investors and contrarian traders. With careful/proper risk management, averaging down can cover losses and magnify the returns when the asset rebounds. However, the main concern for a trader is that it can be hard to identify the difference between a pullback or the start of a new trend.
HOW DOES IT WORK
Averaging down is a method to lower the average price at which the investor buys an asset. A lower average price can help investors come back to break even quicker and, if the price continues to rise, get an even bigger upside and thus increase the total profit from the trade. For example, We buy 100 shares at $60 per share, a total investment of $6000, and then the asset drops to $40 per share; in order to come back to break even, the price has to go up 50%. (($60/$40) - 1)*100 = 50%.
The power of Averaging down comes into play if the investor buys additional shares at a lower price, like another 100 shares at $40 per share; the total investment is ($6000+$4000 = $10000). The average price for the investment is now $50. (($60 x 100) + ($40 x 100))/200; in order to get back to break even, the price has to rise 25% ($50/$40)-1)*100 = 25%, and if the price continues up to $60 per share, the investor can secure a profit at 16%. So by averaging down, investors and traders can cover the losses easier and potentially have more profit to secure at the end.
THE AVERAGE DOWN TRADINGVIEW TOOL
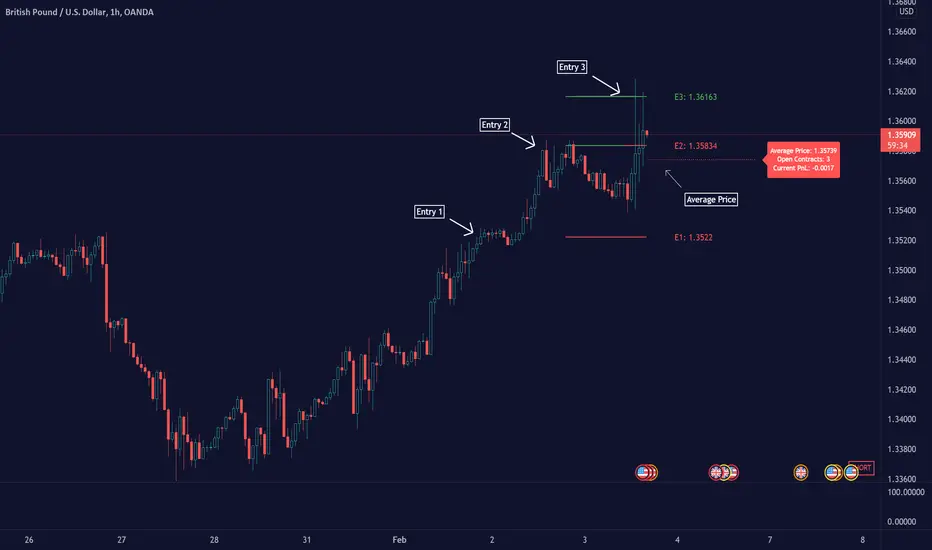
This script/indicator/trading tool helps traders and investors to get the average price of their position. The tool works for Long and Short and displays the entry price, average price, and the PnL in points.
HOW TO USE
APPLY TO CHART
When you apply the tool on the chart, you have to select five entry points, and within the setting panel, you can choose how many of these five entry points are active and how many contracts each entry has. Then, the tool will display your average price based on the entries and the number of contracts used at each price level.
LONG
Set your entries and the number of contracts at each price level. The indicator will then display all your long entries and at what price you will break even. The entry line changes color based on if the entry is in profit or loss.

SHORT
Set your entries and the number of contracts at each price level. The indicator will then display all your short entries and at what price you will break even. The entry line changes color based on if the entry is in profit or loss.

-----------------
Disclaimer
Copyright by Zeiierman.
The information contained in my Scripts/Indicators/Ideas/Algos/Systems does not constitute financial advice or a solicitation to buy or sell any securities of any type. I will not accept liability for any loss or damage, including without limitation any loss of profit, which may arise directly or indirectly from the use of or reliance on such information.
All investments involve risk, and the past performance of a security, industry, sector, market, financial product, trading strategy, backtest, or individual’s trading does not guarantee future results or returns. Investors are fully responsible for any investment decisions they make. Such decisions should be based solely on an evaluation of their financial circumstances, investment objectives, risk tolerance, and liquidity needs.
My Scripts/Indicators/Ideas/Algos/Systems are only for educational purposes!
Averaging down is an investment strategy that involves buying additional contracts of an asset when the price drops. This way, the investor increases the size of their position at discounted prices. The averaging down strategy is highly debated among traders and investors because it can either lead to huge losses or great returns. Nevertheless, averaging down is often used and favored by long-term investors and contrarian traders. With careful/proper risk management, averaging down can cover losses and magnify the returns when the asset rebounds. However, the main concern for a trader is that it can be hard to identify the difference between a pullback or the start of a new trend.
HOW DOES IT WORK
Averaging down is a method to lower the average price at which the investor buys an asset. A lower average price can help investors come back to break even quicker and, if the price continues to rise, get an even bigger upside and thus increase the total profit from the trade. For example, We buy 100 shares at $60 per share, a total investment of $6000, and then the asset drops to $40 per share; in order to come back to break even, the price has to go up 50%. (($60/$40) - 1)*100 = 50%.
The power of Averaging down comes into play if the investor buys additional shares at a lower price, like another 100 shares at $40 per share; the total investment is ($6000+$4000 = $10000). The average price for the investment is now $50. (($60 x 100) + ($40 x 100))/200; in order to get back to break even, the price has to rise 25% ($50/$40)-1)*100 = 25%, and if the price continues up to $60 per share, the investor can secure a profit at 16%. So by averaging down, investors and traders can cover the losses easier and potentially have more profit to secure at the end.
THE AVERAGE DOWN TRADINGVIEW TOOL
This script/indicator/trading tool helps traders and investors to get the average price of their position. The tool works for Long and Short and displays the entry price, average price, and the PnL in points.
HOW TO USE
- Use the tool to calculate the average price of your long or short position in any market and timeframe.
- Get the current PnL for the investment and keep track of your entry prices.
APPLY TO CHART
When you apply the tool on the chart, you have to select five entry points, and within the setting panel, you can choose how many of these five entry points are active and how many contracts each entry has. Then, the tool will display your average price based on the entries and the number of contracts used at each price level.
LONG
Set your entries and the number of contracts at each price level. The indicator will then display all your long entries and at what price you will break even. The entry line changes color based on if the entry is in profit or loss.
SHORT
Set your entries and the number of contracts at each price level. The indicator will then display all your short entries and at what price you will break even. The entry line changes color based on if the entry is in profit or loss.
-----------------
Disclaimer
Copyright by Zeiierman.
The information contained in my Scripts/Indicators/Ideas/Algos/Systems does not constitute financial advice or a solicitation to buy or sell any securities of any type. I will not accept liability for any loss or damage, including without limitation any loss of profit, which may arise directly or indirectly from the use of or reliance on such information.
All investments involve risk, and the past performance of a security, industry, sector, market, financial product, trading strategy, backtest, or individual’s trading does not guarantee future results or returns. Investors are fully responsible for any investment decisions they make. Such decisions should be based solely on an evaluation of their financial circumstances, investment objectives, risk tolerance, and liquidity needs.
My Scripts/Indicators/Ideas/Algos/Systems are only for educational purposes!
發行說明
- Alerts added
開源腳本
本著TradingView的真正精神,此腳本的創建者將其開源,以便交易者可以查看和驗證其功能。向作者致敬!雖然您可以免費使用它,但請記住,重新發佈程式碼必須遵守我們的網站規則。
Access my indicators at: zeiierman.com/
Join Our Free Discord: discord.gg/zeiiermantrading
Join Our Free Discord: discord.gg/zeiiermantrading
免責聲明
這些資訊和出版物並不意味著也不構成TradingView提供或認可的金融、投資、交易或其他類型的意見或建議。請在使用條款閱讀更多資訊。