OPEN-SOURCE SCRIPT
Open-Close / High-Low Ribbon
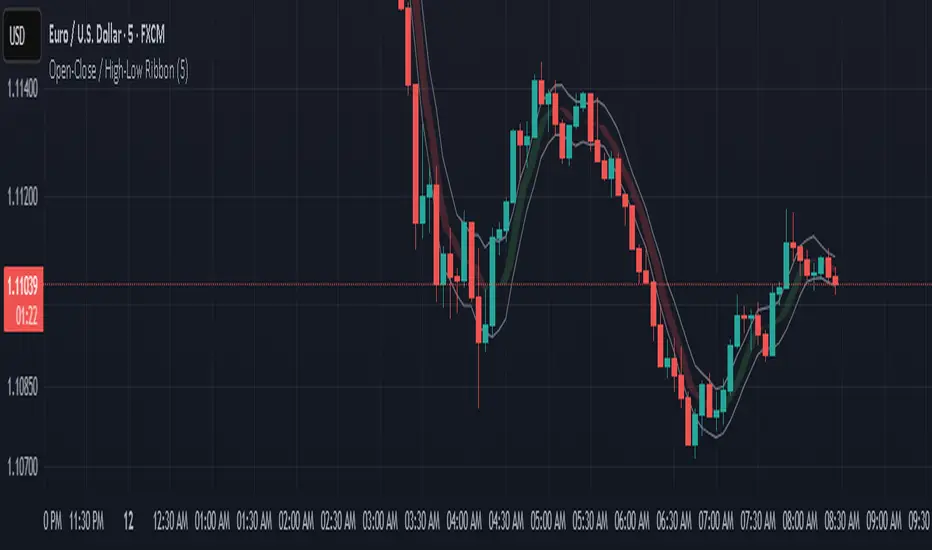
This indicator visualizes smoothed Open, Close, High, and Low price levels as continuous lines, helping users observe underlying price structure with reduced noise. The Open and Close values are shaded to highlight bullish (green) or bearish (red) zones based on their relationship. Smoothing is applied using a simple moving average (SMA) over a user-defined length to make trends easier to interpret. This tool can be useful for identifying directional bias, trend shifts, or areas of support and resistance on any timeframe.
開源腳本
秉持TradingView一貫精神,這個腳本的創作者將其設為開源,以便交易者檢視並驗證其功能。向作者致敬!您可以免費使用此腳本,但請注意,重新發佈代碼需遵守我們的社群規範。
免責聲明
這些資訊和出版物並非旨在提供,也不構成TradingView提供或認可的任何形式的財務、投資、交易或其他類型的建議或推薦。請閱讀使用條款以了解更多資訊。
開源腳本
秉持TradingView一貫精神,這個腳本的創作者將其設為開源,以便交易者檢視並驗證其功能。向作者致敬!您可以免費使用此腳本,但請注意,重新發佈代碼需遵守我們的社群規範。
免責聲明
這些資訊和出版物並非旨在提供,也不構成TradingView提供或認可的任何形式的財務、投資、交易或其他類型的建議或推薦。請閱讀使用條款以了解更多資訊。