INVITE-ONLY SCRIPT
已更新 Tape Speed
Choose a long term averaging period (minutes) and a short term averaging period (seconds)
The indicator will begin loading ticks for the duration of the specified longer term averaging period.
ex: If the indicator is set to have a long term average of 10min, you must run the indicator for 10min first for it to begin its averaging process.
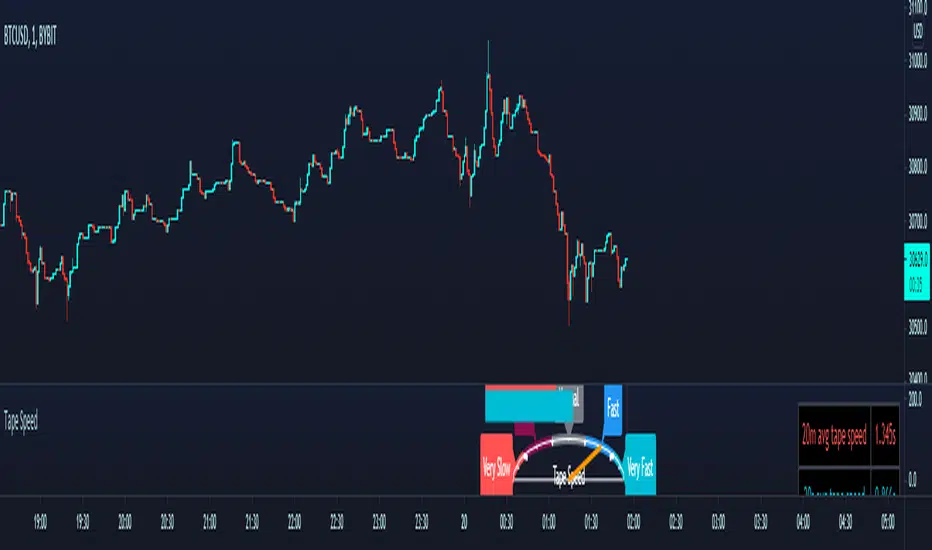
When the required duration of ticks have loaded, it will display the average time elapsed between each tick during that time.
It will also continue to read incoming ticks and calculate new averages once the initial load is finished.
The longer term average is displayed as a static red horizontal bar, the entire speedomter gauge, and the value is also explicitly stated in the top right corner with the table.
The blue bar, the needle, and the bottom row of the table are all representations of the shorter term period's average time between ticks.
The shorter term average is compared against the longer term average to determine whether the short term incoming orders are coming in more aggressively/less aggressively or normally compared to the longer period's average.
___________________________________________________________
Thanks to user rumpypumpydumpy for giving me permission to use his semicircle logic from his "Speedometer Toolbox" to display my own data.

The indicator will begin loading ticks for the duration of the specified longer term averaging period.
ex: If the indicator is set to have a long term average of 10min, you must run the indicator for 10min first for it to begin its averaging process.
When the required duration of ticks have loaded, it will display the average time elapsed between each tick during that time.
It will also continue to read incoming ticks and calculate new averages once the initial load is finished.
The longer term average is displayed as a static red horizontal bar, the entire speedomter gauge, and the value is also explicitly stated in the top right corner with the table.
The blue bar, the needle, and the bottom row of the table are all representations of the shorter term period's average time between ticks.
The shorter term average is compared against the longer term average to determine whether the short term incoming orders are coming in more aggressively/less aggressively or normally compared to the longer period's average.
___________________________________________________________
Thanks to user rumpypumpydumpy for giving me permission to use his semicircle logic from his "Speedometer Toolbox" to display my own data.
發行說明
.僅限邀請腳本
僅作者批准的使用者才能訪問此腳本。您需要申請並獲得使用許可,通常需在付款後才能取得。更多詳情,請依照作者以下的指示操作,或直接聯絡Chonky_。
TradingView不建議在未完全信任作者並了解其運作方式的情況下購買或使用腳本。您也可以在我們的社群腳本中找到免費的開源替代方案。
作者的說明
DM me to beta test if you are familiar with Tape Speed/Pace of Tape from other platforms and use it often. I am looking for suggestions/improvements and need feedback.
免責聲明
這些資訊和出版物並非旨在提供,也不構成TradingView提供或認可的任何形式的財務、投資、交易或其他類型的建議或推薦。請閱讀使用條款以了解更多資訊。
僅限邀請腳本
僅作者批准的使用者才能訪問此腳本。您需要申請並獲得使用許可,通常需在付款後才能取得。更多詳情,請依照作者以下的指示操作,或直接聯絡Chonky_。
TradingView不建議在未完全信任作者並了解其運作方式的情況下購買或使用腳本。您也可以在我們的社群腳本中找到免費的開源替代方案。
作者的說明
DM me to beta test if you are familiar with Tape Speed/Pace of Tape from other platforms and use it often. I am looking for suggestions/improvements and need feedback.
免責聲明
這些資訊和出版物並非旨在提供,也不構成TradingView提供或認可的任何形式的財務、投資、交易或其他類型的建議或推薦。請閱讀使用條款以了解更多資訊。