PROTECTED SOURCE SCRIPT
مؤشرأبو سليمان
🎯 ماذا يفعل المؤشر؟
يقوم بتلوين الشمعة التي تحقق الشروط " سر المهنة " بلون أزرق (أو حسب اختيارك).
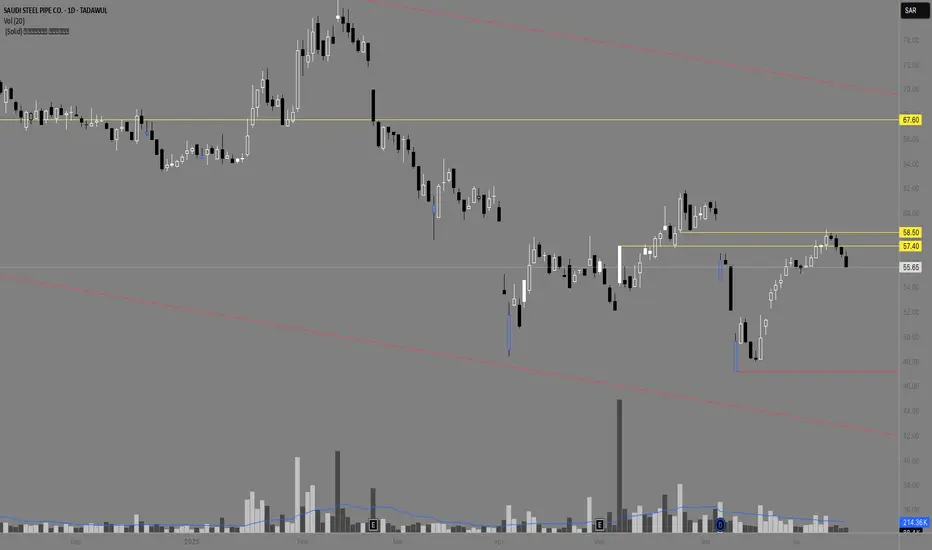
يرسم خطين أفقيين على:
أعلى الشمعة (باللون الأخضر)
أدنى الشمعة (باللون الأحمر)
هذه الخطوط تمتد يمينًا حتى يتم اختراقها بإغلاق جسم الشمعة:
الخط الأخضر يتوقف إذا تم اختراقه صعودًا.
الخط الأحمر يتوقف إذا تم كسره هبوطًا.
🔔 التنبيه:
يوفر المؤشر تنبيهًا تلقائيًا عند اختراق الخط الأخضر، وهو بمثابة إشارة دخول محتملة بعد تجاوز مقاومة الكذب السابقة.
🔊 رسالة التنبيه:
تم اختراق الخط الأخضر لشمعة أبو سليمان
⚙️ الإعدادات القابلة للتخصيص:
تفعيل/إلغاء تلوين الشمعة
اختيار لون الشمعة
اختيار لون ونمط الخط العلوي والسفلي
📌 وقف الخسارة (اختياري):
أسفل أدنى الشمعة التي حققت "كذب الصعود".
أو الخط الأحمر السفلي إن كان مرسومًا.
🎯 المستهدف:
يمكن تحديده بنسبة مخاطرة/عائد 1:2
أو بناءً على أقرب مقاومة.
📢 ملاحظة:
هذه الاستراتيجية مبنية على سلوك سعري،
خيار البيع والشراء وشرعية السهم أنت لوحدك المسؤول عنها
صلى الله عليه وسلم
اذكروني بدعوه
اخوكم أبو سليمان
🎯 What Does the Indicator Do?
The indicator highlights the candle that meets the special “Trade Secret” conditions in blue (or your preferred color).
It then draws two horizontal lines:
A green line at the top of the candle
A red line at the bottom of the candle
These lines extend to the right until they are broken by a full-body candle close:
The green line stops if it is broken to the upside
The red line stops if it is broken to the downside
🔔 Alert:
The indicator provides an automatic alert when the green line is broken.
This is considered a potential entry signal after price breaks through the previous "false breakout" resistance.
🔊 Alert message:
“The green line of the Abu Sulaiman candle has been broken.”
⚙️ Customizable Settings:
Enable/disable candle highlighting
Choose highlight color
Choose color and style for the upper and lower lines
📌 Stop Loss (optional):
Just below the low of the candle that triggered the false rally
Or below the red support line if drawn
🎯 Target:
Based on a 1:2 risk/reward ratio
Or based on the nearest resistance level
📢 Note:
This strategy is based on price behavior and market psychology.
You are solely responsible for your buy/sell decisions and verifying the stock's compliance
and validity.
يقوم بتلوين الشمعة التي تحقق الشروط " سر المهنة " بلون أزرق (أو حسب اختيارك).
يرسم خطين أفقيين على:
أعلى الشمعة (باللون الأخضر)
أدنى الشمعة (باللون الأحمر)
هذه الخطوط تمتد يمينًا حتى يتم اختراقها بإغلاق جسم الشمعة:
الخط الأخضر يتوقف إذا تم اختراقه صعودًا.
الخط الأحمر يتوقف إذا تم كسره هبوطًا.
🔔 التنبيه:
يوفر المؤشر تنبيهًا تلقائيًا عند اختراق الخط الأخضر، وهو بمثابة إشارة دخول محتملة بعد تجاوز مقاومة الكذب السابقة.
🔊 رسالة التنبيه:
تم اختراق الخط الأخضر لشمعة أبو سليمان
⚙️ الإعدادات القابلة للتخصيص:
تفعيل/إلغاء تلوين الشمعة
اختيار لون الشمعة
اختيار لون ونمط الخط العلوي والسفلي
📌 وقف الخسارة (اختياري):
أسفل أدنى الشمعة التي حققت "كذب الصعود".
أو الخط الأحمر السفلي إن كان مرسومًا.
🎯 المستهدف:
يمكن تحديده بنسبة مخاطرة/عائد 1:2
أو بناءً على أقرب مقاومة.
📢 ملاحظة:
هذه الاستراتيجية مبنية على سلوك سعري،
خيار البيع والشراء وشرعية السهم أنت لوحدك المسؤول عنها
صلى الله عليه وسلم
اذكروني بدعوه
اخوكم أبو سليمان
🎯 What Does the Indicator Do?
The indicator highlights the candle that meets the special “Trade Secret” conditions in blue (or your preferred color).
It then draws two horizontal lines:
A green line at the top of the candle
A red line at the bottom of the candle
These lines extend to the right until they are broken by a full-body candle close:
The green line stops if it is broken to the upside
The red line stops if it is broken to the downside
🔔 Alert:
The indicator provides an automatic alert when the green line is broken.
This is considered a potential entry signal after price breaks through the previous "false breakout" resistance.
🔊 Alert message:
“The green line of the Abu Sulaiman candle has been broken.”
⚙️ Customizable Settings:
Enable/disable candle highlighting
Choose highlight color
Choose color and style for the upper and lower lines
📌 Stop Loss (optional):
Just below the low of the candle that triggered the false rally
Or below the red support line if drawn
🎯 Target:
Based on a 1:2 risk/reward ratio
Or based on the nearest resistance level
📢 Note:
This strategy is based on price behavior and market psychology.
You are solely responsible for your buy/sell decisions and verifying the stock's compliance
and validity.
受保護腳本
此腳本以閉源形式發佈。 不過,您可以自由且不受任何限制地使用它 — 在此處了解更多資訊。
免責聲明
這些資訊和出版物並不意味著也不構成TradingView提供或認可的金融、投資、交易或其他類型的意見或建議。請在使用條款閱讀更多資訊。
免責聲明
這些資訊和出版物並不意味著也不構成TradingView提供或認可的金融、投資、交易或其他類型的意見或建議。請在使用條款閱讀更多資訊。