DP_ORB Entry & Exit IndicatorDisclaimer:
This indicator is for educational purposes only. It does not constitute financial advice. Always do your own research and manage your risk. Also, I cannot take full credit for 'ORB' as its a well known strategy amongst many traders, but I do need to give a special shout out to @TheBigDaddyMax for putting me on to this.
DP_ORB Entry & Exit Indicator
Description:
The DP_ORB Entry & Exit Indicator is a powerful tool designed for traders who utilize the Opening Range Breakout (ORB) strategy on the NYSE session. This indicator visually identifies the initial volatility window of the trading day, by marking the 15m High, and 15m Low into a ORB Box, & then tracks breakout opportunities, and provides clear, dynamic trade management levels—all directly on your chart.
Key Features:
Automatic Opening Range (ORB) Box:
Identifies and plots the high and low of the user-defined opening range (default 9:30–9:45 NYSE) for visual reference and strategy foundation.
Breakout Entry Signals:
Automatically detects and marks long or short breakout entries when price closes above or below the ORB range, with additional momentum confirmation.
Dynamic Stop Loss:
Stop loss is intelligently set to the previous bar’s low for long trades (or high for shorts), adapting to market structure at entry.
Take Profit Targets:
Up to three fully adjustable take-profit levels are plotted, calculated as percentages from entry, supporting progressive trade management.
Visual Trade Management:
Entry, stop loss, and take profit levels are displayed as extending dashed lines from entry point to the current bar, with labels always shown just to the right of price for clarity on all timeframes.
Automatic Reset and Cleanup:
Visuals and logic reset daily and upon exit, ensuring a clean, uncluttered chart experience.
How to Use:
Set your preferred opening range time and take profit levels in the settings.
Wait for a breakout and confirmation during the NYSE session.
Use the on-chart lines and labels to manage your trade according to your risk and strategy plan.
Best For:
Day traders and scalpers seeking a disciplined, visual, and fully-automated approach to opening range breakout trading.
圖表形態

EdgeXplorer - Smart Candle Patterns + SwingsEdgeXplorer – Smart Candle Patterns & Swings
Smart Candle Patterns & Swings by EdgeXplorer is a dual-function visual analysis tool that intelligently detects major swing points and overlays them with recognized candle reversal patterns. This tool brings together classical candlestick analysis and market structure theory, helping traders identify high-probability zones where price action may shift.
The script not only marks swing highs/lows as HH, LH, HL, or LL, but also labels key candlestick patterns—from Hammers to Engulfings to Three Black Crows—providing real-time context for possible trend continuation or reversal setups.
⸻
🔍 What Does This Tool Do?
This indicator performs two primary functions:
1. Swing Structure Labeling – Marks each new pivot as a higher high (HH), lower high (LH), higher low (HL), or lower low (LL)
2. Smart Candle Pattern Detection – Identifies 14 of the most widely studied candlestick reversal patterns and displays them alongside the swing label
It’s a lightweight, unobtrusive way to bring structure and pattern recognition to your chart—no repainting, no noise, and no signal promises.
⸻
⚙️ How It Works – Technical Breakdown
1. Swing Highs and Lows
• The script uses a pivot detection window (Pivot Length) to find local swing highs and lows
• When a new pivot forms:
• It is classified as one of:
• HH – Higher High
• LH – Lower High
• HL – Higher Low
• LL – Lower Low
• These swing points act as visual guides for traders tracking structure
2. Candlestick Pattern Logic
At each confirmed pivot, the script evaluates the candle and its neighbors for a match from a built-in library of 14 classical reversal patterns:
Pattern Description
Hammer Small body, long lower wick – bullish signal after a downtrend
Inverted Hammer Long upper wick, signals failed bearish push
Bullish Engulfing Green candle fully engulfs red one
Bearish Engulfing Red candle fully engulfs green one
Hanging Man Long lower wick after uptrend, often bearish
Shooting Star Long upper wick after uptrend, bearish signal
Doji Small or zero body, signals indecision
Morning Star Three-candle bullish reversal pattern
Evening Star Three-candle bearish reversal pattern
Spinning Top Small body with upper/lower wicks, signals indecision
Bullish Marubozu Large green candle with no wicks
Bearish Marubozu Large red candle with no wicks
Three White Soldiers Three large bullish candles in a row
Three Black Crows Three large bearish candles in a row
Each pattern is detected using precise criteria based on body size, wick ratios, and relative position to previous candles.
⸻
📈 What You See on the Chart
Visual Meaning
Swing Label (e.g., HH, LL) Identifies structural pivot and its type
Pattern Name (e.g., Doji, Bullish Engulfing) Displayed alongside swing label if pattern is detected
Label Tooltip Shows a short description of the pattern’s meaning
Color
• Swing High = red (customizable)
• Swing Low = green (customizable)
⸻
📊 Inputs & Customization
Input Description
Pivot Length Number of bars to the left/right used to confirm swing highs/lows
Swing High Label Color Customize color of HH/LH labels
Swing Low Label Color Customize color of HL/LL labels
All labels are plotted using small visual markers to avoid cluttering the chart.
⸻
🧠 How to Interpret It in Live Markets
This indicator provides context, not confirmation. Use it to:
• Validate your manual swing structure tracking with automatic HH/LL labels
• Identify when a key candle pattern forms at a major swing (e.g., Shooting Star at a HH)
• Spot potential reversal zones or breakout failures
• Add confluence to Smart Money Concepts, price action setups, or other technical strategies
Example:
• A new LL forms with a Hammer → Potential reversal from bearish exhaustion
• A HH forms with a Shooting Star → Possible trap or overextension
⸻
🧪 Use Case Ideas
• 🔄 Reversal Confirmation – Combine swing structure with pattern match for early reversal entries
• 🧭 Structure Validation – Let the HH/LL labels validate your trend bias
• 📉 Exhaustion Signals – Watch for Doji/Spinning Top patterns at mature moves
• ⚠️ Avoid Choppy Conditions – Use absence of patterns to avoid entering low-conviction zones
This tool works across all asset classes: crypto, forex, stocks, indices, and even futures.

Buy High, Cry Later™ [v.1]🟢 Buy Signal Logic:
RSI > 200? Buy.
MACD crossing in the opposite direction? Buy harder.
A green candle appeared? That’s bullish af.
Elon tweeted something? YOLO all-in.
Signal confirmed by 2 pigeons landing on your window.
🔴 Sell Signal Logic:
Price down 0.1%? Panic sell.
Your neighbor just bought in? Dump it.
Wife walks in? Liquidate everything and pretend you're doing taxes.
Trade hit breakeven? Close immediately, you're not greedy.
💬 Alerts Include:
“Moon incoming 🚀🚀 (probably...)”
“Dump detected – but it might reverse. Or not. Who knows.”
“Just close the chart and go outside, man.”
🛠️ Features:
Ultra-premium “Repaint Mode” – only shows correct signals after they worked.
Martingale-enhanced entries: “Double down or cry trying.”
AI-enhanced backtest: 100% win rate on cherry-picked data from 2003.
⚠️ Disclaimer:
This tool may cause excessive optimism, overtrading, or spontaneous weeping. Not responsible for margin calls or emotional damage.

[FREE] Multiple Indicators Screener [NASAlgoTrading] Multiple Indicators Screener indicator is designed to help traders quickly scan multiple cryptocurrencies across different timeframes using a combination of proven technical indicators. It provides a comprehensive, at-a-glance view of market conditions to help identify high-probability trading opportunities.
How It Helps Traders Maximize Profits
✅ Saves Time – No need to switch between charts; all key metrics are displayed in one place.
✅ Confirms Trends – Combines multiple indicators to filter high-probability setups.
✅ Multi-Timeframe Alignment – Finds trades where short-term and long-term trends agree.
✅ Overbought/Oversold Alerts – Helps spot potential reversals using RSI, Stochastic, and TSI.
✅ Trend Strength Validation – ADX and Supertrend confirm whether a trend is worth trading.
Why Use This Script?
✔ Completely Free – No hidden costs or premium upgrades.
✔ Easy to Use – No complex setup; works out of the box.
✔ Customizable – Adjust timeframes, indicators, and assets to fit your strategy.
Best For:
Swing Traders – Identify trends across multiple timeframes.
Day Traders – Quickly scan for intraday opportunities.
Crypto Traders – Optimized for popular cryptocurrency pairs.
Start using this powerful screener today to enhance your trading efficiency and spot the best setups with ease! 🚀

Normalized Fibonacci Retracement (MTF/LOG)A question: Instead of creating indicators that constantly plot Fibonacci Retracement levels in a visually overwhelming way, why don't we redefine them on a different scale? 🤨
Overview
The Normalized Fibonacci Retracement indicator converts price data to a 0-100 scale based on the selected timeframe's high-low range, displaying normalized candlesticks alongside standard Fibonacci levels (23.6%, 38.2%, 50%, 61.8%, 78.6%). This normalization reveals patterns that may be hidden in absolute price charts and allows consistent analysis across different instruments.
Originality
By normalizing prices to percentages, this indicator enables pattern recognition independent of absolute price levels. The same formation at $10-$20 and $1000-$2000 appears identical on the normalized scale, helping traders identify recurring structures across various assets and timeframes.
Concepts
The indicator uses a simple formula to transform price data into percentages. This creates a bounded scale where patterns become comparable regardless of the underlying asset's price range. The normalized view often reveals symmetries and relationships not visible in traditional price charts.
Mechanics
The system tracks highs and lows within the selected timeframe as anchor points. When a new period begins, fresh boundaries are established and prices recalculated. Trend direction is determined by timing of extremes. Linear scaling uses direct percentage calculation, while logarithmic scaling applies exponential interpolation for assets with large percentage moves.
Functions
Timeframe Selection: Higher timeframe analysis on any chart resolution
Normalized Display: OHLC data converted to 0-100 percentage scale
Fibonacci Levels: Standard retracement levels plotted automatically
Scaling Options: Linear or logarithmic calculation methods
Pattern Recognition: Reveals formations hidden in absolute price charts
Moving Average: Optional 20-period SMA overlay
Notes
Ensure chart data covers the full selected timeframe for accurate calculations. Use logarithmic scaling for volatile assets with large percentage moves. The normalized scale is effective at revealing patterns and structures that remain consistent across different price ranges, making it particularly useful for comparative analysis and pattern-based trading strategies.
I hope it helps everyone. Do not forget to manage your risk. And trade as safely as possible. Best of luck!

EdgeXplorer - Profit Bottoms EdgeXplorer – Profit Bottoms
⸻
🔍 What This Indicator Does
Profit Bottoms is a custom momentum oscillator designed to reveal price strength inflections through correlation logic. It identifies potential market exhaustion zones, highlights overbought/oversold conditions, and visually marks swing tops and bottoms — helping traders pinpoint profit-taking opportunities or early reversals across any asset or timeframe.
It features a flexible histogram view, color-coded background trends, and precision labels for clearer insight into market sentiment momentum shifts.
⸻
⚙️ How It Works
At the core of this indicator is a correlation function:
• It measures how strongly the price (close) correlates with bar index progression over a lookback window — essentially evaluating how directional recent price action has been.
• This results in a “strength index” ranging between +1 (strong uptrend) and -1 (strong downtrend).
• It tracks the slope of this index to infer trend direction and visually represent shifts.
From there, the indicator layers on:
• Dynamic overbought/oversold zones (±0.9)
• Swing high/low detection based on local peaks and troughs
• Trend background shading based on momentum slope
• Optional histogram and fill display styles
⸻
📈 Visual Components Explained
Element Meaning
🔮 Pulse Strength Line (purple line) Primary oscillator showing strength of directional movement
🌈 Colored Fill Fills above/below baseline to represent bullish/bearish intensity
🟢 Green Background Slope of strength index is rising (trend gaining)
🔴 Red Background Slope of strength index is falling (trend weakening)
🔼 ↑ Label Price is entering extreme overbought territory
🔽 ↓ Label Price is entering extreme oversold territory
🟠 Circle Markers Swing Top (Teal) or Swing Bottom (Orange)
📊 Histogram / Line Style Alternate visualizations of the oscillator based on user preference
⸻
📊 Input Settings Explained
Setting Description
Window Size Lookback period for correlation calculation
Bull Fill / Bear Fill Gradient colors for up/down momentum
Mark Tops/Bottoms Enables visual detection of swing highs/lows
Highlight Overbought/Oversold Displays zone entry markers (↑/↓) near extremes
Show Pulse Histogram Adds either histogram or line view
Histogram Style Choose between histogram bars, a thin line, or hide the visual entirely
⸻
🧠 How to Interpret in Different Market Conditions
Condition Interpretation
Strength Index near +1 Strong upward correlation — trend likely maturing or overbought
Strength Index near -1 Strong downward correlation — trend possibly exhausted or oversold
Cross below 0 Momentum shift from bullish to bearish
Cross above 0 Momentum shift from bearish to bullish
Swing Top Detected Potential short-term exhaustion — profit zone for longs
Swing Bottom Detected Early reversal zone or buying opportunity
The colored background makes it easy to visually segment the chart by trend environment, while the swing markers and zone labels add precision entry/exit timing cues.
⸻
🧪 Use Cases & Strategy Tips
• Scalpers & intraday traders: Use swing tops/bottoms with zone labels for tight entries.
• Swing traders: Watch for strength fading as a warning sign to exit positions.
• Divergence Spotting: Compare price action to the oscillator for hidden signals.
• Momentum Riders: Use histogram mode with background coloring to stay in trend longer.
For example:
If you see a swing bottom occur just below the -0.9 zone, paired with a background color flip from red to green — that’s a high-probability setup for reversion or breakout.
⸻
🧷 Alerts Included
This indicator provides built-in alerts for key conditions:
• EPS+ Top Detected → Swing Top
• EPS+ Bottom Detected → Swing Bottom
• EPS+ Overbought Zone → Strength Index > 1
• EPS+ Oversold Zone → Strength Index < -1
These can be used in alert-based automation or simply for manual signal confirmation.

Fair Value Gap & Liquidity Zones [Combined]mixed FVG and buyside and sellside liquidity
xxxxxxxxxxxxxxxxxxxxxxxxxxxxxxxxxxxxxxxxxxxxxxxxxxxxxxxxxxxxxxxxxxxxxxxxxxxxxxxxxx

Universal Trade Levels & Signal Classifierscript has been enhanced and generalized for all instruments — not just ES or SPX.
You now get the following classifications:
💎 Perfect Trade – trend confirmed, strong signal, ATR + VWAP + volume aligned
🚀 Sure Shot Trade – very high volume + ATR breakout + directional bias
⚡ Quick Call/Put – fast actionable setups
❌ No Trade – avoid/no confirmation
The logic works across any timeframe and any ticker.
You can now test this live on any instrument in TradingView. Let me know if you’d like to add things like:
Multi-timeframe confirmation
Re-entry logic
Heatmap table of confidence levels
Signal filtering based on RSI, OBV, etc.

{FREE} Candlestick Patterns [NASAlgoTrading]{FREE} Candlestick Patterns identifies and plots various candlestick patterns on price charts. It helps traders visualize potential reversal and continuation patterns in the market.
Key Features
Bullish Reversal Patterns Detected:
Hammer - Signals potential bullish reversal after a downtrend
Inverted Hammer - Indicates possible bullish reversal
Three White Soldiers - Strong bullish reversal pattern showing consecutive bullish candles
Bullish Harami - Shows potential trend reversal from bearish to bullish
Bearish Reversal Patterns Detected:
Hanging Man - Warns of potential bearish reversal after an uptrend
Shooting Star - Suggests possible bearish reversal
Three Black Crows - Strong bearish reversal pattern showing consecutive bearish candles
Bearish Harami - Indicates potential trend reversal from bullish to bearish
Dark Cloud Cover - Shows bearish reversal potential
Continuation Patterns Detected:
Rising Three Methods - Bullish continuation pattern
Falling Three Methods - Bearish continuation pattern
Gravestone Doji - Can indicate potential reversals (shown in orange)
Long-legged Doji - Shows market indecision (shown in orange)
Dragonfly Doji - Can signal potential reversals (shown in orange)
Benefits for Traders
Visual Pattern Recognition: Automatically identifies and labels patterns on the chart, saving traders time in manual analysis.
Comprehensive Coverage: Detects multiple important candlestick patterns in a single indicator.
Clear Visual Cues:
Bullish patterns marked in green below price bars
Bearish patterns marked in red above price bars
Doji patterns marked in orange
Trend Analysis: Helps identify both reversal and continuation patterns, providing insights into potential market direction.
Confirmation Tool: Can be used alongside other technical indicators to confirm trading signals.
Educational Value: Helps new traders learn to recognize important candlestick patterns.
Customization: The indicator allows for up to 50 lines to be displayed (max_lines_count = 50).
Implementation Notes
The indicator uses precise mathematical conditions to identify each pattern, including:
Relative candle body and wick sizes
Previous candle patterns and trends
Price relationships between current and historical candles
This systematic approach ensures consistent pattern recognition that might be subjective when done manually.

Monday Range +Monday Range+
A precision tool for early-week price action traders.
🔧 Features:
- Auto-draws Monday High, Low & Midrange
- Clear LONG/SHORT signal labels
- Midrange Reset (reloads trade logic)
- Ex-Line Protection (sweep filter)
- ½ Risk to Reward extension option
- Multi-Timeframe (MTF) support
📈 Trade Setup Logic:
LONG Setup:
- Valid only after Monday
- Price breaks below Monday Low
- Closes back above the Low and under the Midrange
- Candle must close higher than previous candle
- If Ex-Line Protection is on, trade is blocked if price swept below extension
- Enter at the Low of the range, target the High
SHORT Setup:
- Valid only after Monday
- Price breaks above Monday High
- Closes back below the High and above the Midrange
- Candle must close lower than previous candle
- If Ex-Line Protection is on, trade is blocked if price swept above extension
- Enter at the High of the range, target the Low
🎯 Ideal for liquidity fades and range reversal setups.

HTF Candle Extremes Zigzag (Drawn on LTF)HTF Candle Extremes Zigzag (Drawn on LTF)
This indicator plots zigzag lines connecting the extremes (highs and lows) of Higher Timeframe (HTF) candles directly on your lower timeframe (LTF) chart. It visually highlights trend changes and HTF candle structure by drawing colored lines representing uptrends and downtrends based on HTF candle extremes.
"Key Features"
Higher Timeframe Tracking: Select any HTF to track candle extremes using the built-in security function.
Zigzag Lines: Connects HTF candle lows to highs in an intuitive zigzag pattern.
Trend Indication: Uptrend lines are green, downtrend lines are red (customizable colors).
Customizable Line Width: Adjust the thickness of the zigzag lines for better visibility.
Drawn on Lower Timeframe: All lines appear on your active lower timeframe chart, allowing easy visual correlation.
"How It Works"
The script fetches the open, high, low, close, and time data of the specified HTF candle. It detects new HTF bars and identifies trend direction changes by comparing the highs and lows of consecutive HTF candles.
- When an uptrend is detected, vertical lines are drawn from low to high of the HTF candle, connected to the previous extreme low.
- When a downtrend is detected, vertical lines are drawn from high to low, connected to the previous extreme high.
- Transitions between trends are highlighted by connecting the last extreme of the previous trend to the current extreme, creating a clean zigzag pattern.
Usage Notes:
Ideal for traders who want to visualize HTF market structure and trend changes while analyzing price action on lower timeframes.
---
© The_Forex_Steward
(mozilla.org)

Irregular Wick + QQE ConfluenceThis indicator combines irregular candlestick wick analysis with QQE (Quantitative Qualitative Estimation) momentum confirmation to identify potential reversal points in price action.
What it does:
Detects unusually large wicks that may indicate price rejection at key levels
Uses QQE trend analysis to filter signals and reduce false positives
Provides both basic and enhanced signal types for different trading strategies
Key Features:
Wick Detection: Identifies candles where wicks are significantly larger than the body, suggesting strong rejection of price levels
QQE Confluence: Filters signals based on QQE momentum trend (bullish/bearish/neutral)
Enhanced Signals: Combines wick detection with QQE signal line crossovers for stronger confirmation
Visual Aids: Background coloring shows QQE trend, info table displays current market conditions
Customizable Parameters: Adjust wick sensitivity, QQE settings, and confluence requirements
Signal Types:
Basic Signals: Irregular wicks aligned with QQE trend direction
Enhanced Signals: Irregular wicks combined with QQE signal crossovers
Long Signals: Generated after irregular lower wicks in bullish QQE conditions
Short Signals: Generated after irregular upper wicks in bearish QQE conditions
Educational Purpose:
This tool is designed for educational analysis of price action patterns and momentum indicators. It helps traders understand how wick formations relate to underlying momentum conditions.
Settings:
Wick detection sensitivity (multiplier and percentage thresholds)
QQE parameters (RSI period, smoothing, threshold levels)
Optional confluence requirement toggle
Visual display preferences
Disclaimer: This indicator is for educational and analytical purposes only. Past performance does not guarantee future results. Always conduct your own analysis and risk management before making trading decisions.
Note: Signals should be used in conjunction with other forms of analysis including support/resistance levels, market context, and proper risk management techniques.
This description focuses on the educational and analytical aspects while avoiding any direct trading advice or performance claims that could violate TradingView's guidelines.

Futures Support & Resistance LevelsMulti-Timeframe Support & Resistance Levels for Futures Trading
Description:
This indicator automatically identifies and displays key support and resistance levels using multiple technical analysis methods. Designed specifically for futures traders (ES, NQ, etc.), it provides a clean, organized view of important price levels.
Key Features:
Multiple Detection Methods: Combines pivot points, daily ranges, and psychological levels
Smart Ranking System: Levels are numbered by strength (1 = strongest)
Clean Visualization: Extended lines across the chart with clear price labels
Confluence Detection: Highlights areas where multiple levels converge
Customizable Display: Adjust colors, line styles, and label sizes
Level Types Identified:
Daily High/Low (current session)
Previous Daily High/Low
Pivot-based Support/Resistance
Psychological Round Numbers
Confluence Zones (multiple levels clustering)
Technical Approach:
The indicator uses a strength-scoring algorithm to rank levels by importance. Daily levels receive the highest weighting (2.0), followed by previous daily levels (1.5), pivot points (1.0), and psychological levels (0.5). This helps traders focus on the most significant levels.
Visual Elements:
Solid lines = Strong levels
Dashed lines = Medium levels
Dotted lines = Weak levels
Optional technical condition markers for educational analysis
Best Used For:
Identifying key intraday levels for futures trading
Finding high-probability reversal zones
Setting logical stop-loss and take-profit levels
Recognizing confluence areas for stronger setups
Note:
This is a technical analysis tool for educational purposes. No indicator can predict future price movements. Always use proper risk management and combine with other forms of analysis.

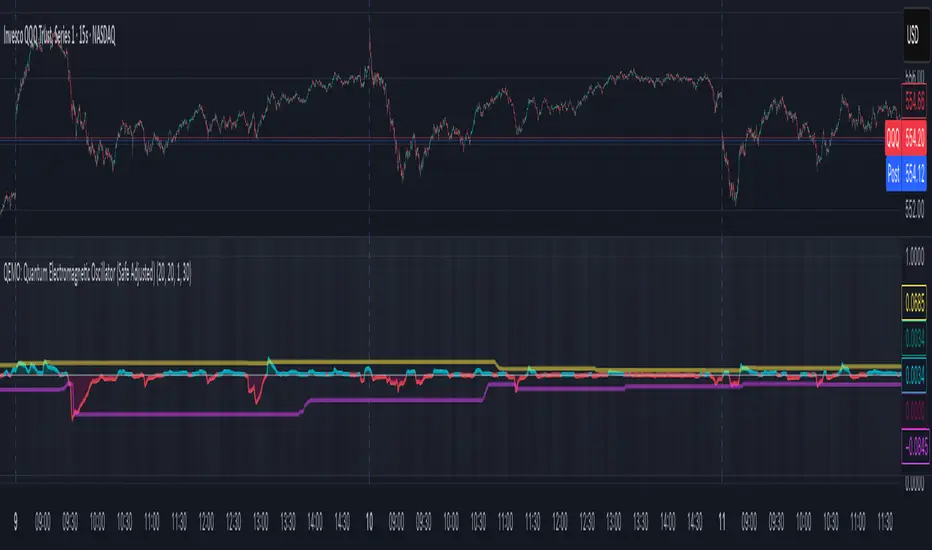
QEMO: Quantum Electromagnetic Oscillator (Safe Adjusted)This is a highly conceptual and oscillator and It attempts to model market dynamics by borrowing concepts from quantum physics and electromagnetism to create a unique oscillator. It does not represent any real physical phenomena but uses these concepts as metaphors for market forces.
Here is a breakdown of its core components:
1. Quantum Price Wavefunction (The Core Price Engine)
This is the most abstract part of the script. It tries to model price not as a single point, but as a "wavefunction" representing a distribution of probable future prices.
Volatility & Price Grid: It first calculates recent market volatility. Based on this volatility, it creates a dynamic grid of possible price levels (price_bins) around the current price.
Probability Density: It assigns a probability to each price level in the grid.
"Energy" Operators:
Kinetic Energy: Metaphorically represents the "momentum" or rate of change of the price probabilities.
Potential Energy: A force field that influences the probabilities, derived from a combination of volatility and trading volume.
Expected Price: After evolving these probabilities, it calculates a single "expected price" which is the weighted average of all prices in the grid, based on their final probabilities.
2. Electromagnetic Fields (Buying vs. Selling Pressure)
This section models the battle between buyers and sellers in a more familiar way:
E-Field (Electric/Buying): Represents buying pressure, calculated from upward price moves (close - open) multiplied by volume.
B-Field (Magnetic/Selling): Represents selling pressure, calculated from downward price moves (open - close) multiplied by volume.
Lorentz Force (F_net): This is the net force (E - B), representing the overall directional pressure in the market. A positive value means buyers are in control; a negative value means sellers are.
3. Entanglement Entropy (Systemic Risk/Stability)
This component aims to measure the market's stability or "systemic risk."
It calculates a form of auto-correlation on recent price returns.
A high degree of instability in this correlation results in a high "Entropy" (S) value.
Essentially, a high S suggests the market is chaotic and unpredictable (low stability), while a low S suggests it is more stable and trending.
4. Final QEMO Calculation & Plotting
All the components are combined to create the final oscillator value:
Final Value: The qemo value is a product of the expected_price, the amplified net force, and the market stability (1 - S).
Smoothing: This raw qemo value is then smoothed with an Adaptive Moving Average (AMA) to produce the final line that gets plotted on the chart.
Visualization:
The main oscillator line is plotted below the chart. Its color changes based on its value (e.g., blue for positive, red for negative).
The background color of the indicator pane changes based on the Entropy (S), providing an immediate visual cue of market stability (e.g., black for stable, white for chaotic).
The script also plots 99th and 1st percentile bands to help identify statistically extreme readings in the oscillator's value.
CRT + PO3 Range Theory Hey everyone, I’ve put together a little script for TradingView that tries to show the classic CRT + PO3 (Power of Three) pattern. It’s still a work in progress, so please use it on a demo account and let me know what you think!
What It Does
Accumulation Phase: On each higher‐timeframe bar (e.g. 2-hour), it draws a shaded zone where price is hanging out. That’s when we assume “big players” are quietly building positions.
Manipulation Phase: If price briefly pokes above or below that zone but then slips back inside, it marks that wick as a shake-out.
Distribution Phase: When price finally closes cleanly outside the zone, it draws another shaded area and drops a “Distribution” label plus a big LONG or SHORT arrow on that bar.
You can tweak it so it only shows signals when a bar closes (no more weird flashing mid-bar), or even allow “direct” Distribution on a clean breakout without waiting for a fake wick first.
How to Set It Up
Add the script from your Indicators list.
Pick your HTF (I like 2-hour or 4-hour).
Turn “Show Zone Labels” on or off—these are the little “Accumulation/Manipulation/Distribution” tags.
Turn “Show Entry Signals” on to get the big LONG/SHORT arrows.
If you hate flicker, check “Show signals only at bar close.”
If you want to catch a swift breakout (no fake-out needed), check “Allow direct Distribution on clean breakout.”
There are also sliders for zone colors, transparency, label size, and how far above/below the bars the labels sit.
Why It’s Still a Beta
I’m not a CRT/PO3 guru—this is more of a hobby project and a little facination for this strategy.
There might be edge cases where it misses a shake-out or flags a Distribution too early.
I take no responsibility for your trades—please only run it on a demo account until we’ve worked out the quirks.
Feedback Wanted!
If you try it out, I’d love to hear:
Did the Manipulation wicks line up where you expected?
Were the Distribution arrows on the right bars?
Any ideas for easier settings or extra alerts?
Thanks for testing and helping me turn this into something solid!

Enhanced Neowave Wave 1 Finder with ZigZagThis script is an advanced technical analysis indicator for the TradingView platform, written in Pine Script version 5. Its primary goal is to identify potential Elliott Wave "Wave 1" patterns, enhanced with principles from Neowave theory and a custom ZigZag indicator for more accurate pivot detection. The script is designed to be overlaid on the main price chart.
Core Functionality: Blending ZigZag and Neowave
The indicator's methodology is a two-part process. First, it identifies significant price swings using a robust ZigZag indicator. Then, it analyzes these swings based on a set of rules derived from Neowave and classic technical analysis to validate them as potential Wave 1 patterns.
Part 1: ZigZag Integration
The first major component is a comprehensive ZigZag indicator that forms the foundation for all subsequent analysis.
Pivot Detection: The pivots() function is the engine of the ZigZag. It scans the historical price data for significant high and low points (pivots) over a user-defined Length.
Segment Drawing: Once pivots are identified, the script draws lines connecting them, creating the classic ZigZag pattern on the chart.
Extended Direction & Ratios: This is an enhanced feature. The script doesn't just identify highs and lows; it categorizes them as:
Higher High (HH) or Lower High (LH)
Lower Low (LL) or Higher Low (HL)
This classification is crucial for understanding the market structure. It also calculates the price ratio of the most recent ZigZag leg relative to the previous one, which is used later for pattern validation.
Dynamic Updates: The ZigZag is not static. On each new bar, it can update its most recent pivot point if a new, more extreme price (a higher high or a lower low) is printed before the direction officially changes. This ensures the ZigZag is always reflecting the most current and significant price action.
Part 2: Neowave Wave 1 Finder
With the market structure defined by the ZigZag, the second part of the script applies a rigorous set of rules to identify potential Wave 1 patterns. A Wave 1 is the initial move of a new trend in Elliott Wave theory.
Key Validation Criteria
For a price move between two ZigZag pivots to be considered a valid Wave 1, it must pass a series of checks:
Significance: The move must have a minimum percentage change (Minimum Wave Length) and last for a minimum number of bars, filtering out insignificant noise.
Volume Confirmation: A genuine impulse wave is typically supported by increasing volume. The script checks if the volume during the potential Wave 1 is significantly higher than the recent average (Volume Increase Threshold).
Momentum Alignment: The direction of the wave must be confirmed by momentum indicators.
For a bullish (upward) Wave 1, the Relative Strength Index (RSI) must be in a bullish regime (above 50) and the MACD line must be above its signal line.
For a bearish (downward) Wave 1, the RSI must be below 50 and the MACD line must be below its signal line.
Structural Analysis (Impulse vs. Diagonal): The script attempts to differentiate between two types of Wave 1:
Impulse Wave: A strong, clean, and direct move.
Diagonal Wave: A more complex, overlapping, and often wedge-shaped pattern. This is identified by analyzing the time and price complexity of the move, along with the ZigZag leg ratios.
Wave 2 Retracement Check: A critical Neowave rule is that a valid Wave 1 must be followed by a valid Wave 2 retracement. The script looks at the next ZigZag leg to ensure it doesn't retrace more than 100% of the potential Wave 1. It also uses the ZigZag ratios to confirm the retracement falls within typical Fibonacci levels (e.g., 38.2% to 78.6%).
Display and User Interface
The script provides a rich visual experience to aid the trader in their analysis.
Wave Labels and Boxes: When a valid Wave 1 is detected, it is highlighted with a colored line (green for bullish, red for bearish) and a shaded background box. A label clearly marks it as "Wave 1 IMPULSE" or "Wave 1 DIAGONAL".
Fibonacci Retracement Levels: Upon detection of a Wave 1, the script automatically draws key Fibonacci retracement levels (38.2%, 50%, 61.8%, 78.6%). These levels are potential targets for the end of the subsequent Wave 2, offering potential entry points for a Wave 3 trade.
Information Labels: Additional labels provide at-a-glance confirmation of the conditions, showing whether volume and momentum criteria were met.
Customizable Inputs: Users have extensive control over the indicator's parameters, including the ZigZag length, volume thresholds, RSI levels, and the colors of all visual elements.
Alerts: The indicator can be configured to generate an alert whenever a new bullish or bearish Wave 1 pattern is confirmed, allowing traders to be notified of potential opportunities in real-time.

EdgeXplorer - Sessions Roulette 🕰️ EdgeXplorer – Sessions Roulette
⸻
🔍 What This Indicator Does
Sessions Roulette is a highly customizable tool that visualizes the four primary global trading sessions — New York, London, Tokyo, and Sydney — directly on your chart.
It not only highlights each session’s time window with color-coded boxes, but also tracks key session-level data like:
• Highs and lows
• Average (mean) price
• (Optional) VWAP line (toggle included for future use)
This tool is purpose-built for traders who rely on time-based volatility patterns, session transitions, and liquidity windows.
⸻
⚙️ How It Works (Technical Breakdown in Plain English)
This indicator checks — for each trading session — whether the current bar falls within the defined session time range. If it does:
1. A colored box is drawn from session open to close
2. High/Low levels for that session are tracked dynamically
3. The session’s mean price is calculated incrementally as new bars come in
4. Session labels are rendered as text (optional)
5. Once the session ends, the data locks and resets on the next session start
The timezone can be defined manually via UTC offset or aligned with the chart’s exchange timezone using a toggle.
⸻
📈 Visual Components Explained
Each session (NY, LDN, TYO, SYD) has its own:
• Colored Box Range: This fills the background of the session with a semi-transparent box.
• Session Label: A tag that names the session.
• Mean Line: Tracks average price during the session (toggle).
• High/Low Plots: Draw horizontal lines showing session high and low prices (toggle).
• VWAP Line: Placeholder toggle exists — functionality is not yet implemented.
• Box Outline: Optional stroke around each session box.
⸻
📊 Input Settings & Customization
🔧 General Settings:
• Timezone Offset (UTC ±): Manually adjust sessions to your preferred UTC offset.
• Use Chart Exchange Timezone: Toggle to override the offset and align sessions to the chart’s market timezone.
🎯 Per-Session Settings:
For each of the four sessions, you can configure:
Option Description
Enable Session Toggles the session on or off
Session Label Custom text for labeling
Time Window Start and end time for session
Color Box and line color
Highlight Range Whether to draw the background box
Trend Line (Reserved for future)
Average Line Shows running mean of price during session
VWAP Line (Toggle available; VWAP logic not yet implemented)
High/Low Lines Horizontal lines at the session high/low
🧪 Display Options:
• Range Fill Opacity: Controls transparency of the session box.
• Draw Range Outline: Adds a border to the session box.
• Session Label: Toggles visibility of the session name label.
⸻
🧠 How Traders Can Interpret It
Session tools are most powerful when:
• You trade session-to-session behaviors (e.g., NY open reaction to LDN range)
• You study liquidity zones or order flow around session highs/lows
• You want to anchor technical setups to session timing
• You analyze volatility compression/expansion across global markets
Each session often brings different behaviors:
Session Use Insight
Tokyo Often range-bound, ideal for pre-positioning
London Brings first significant volatility
New York Tends to expand volatility or reverse trends
Sydney Quietest — good for range analysis or preparing for Asia open
⸻
🧪 Use Cases & Strategy Integration
• Breakout Traders: Set alerts when price breaks previous session highs/lows.
• Scalpers: Time entries based on opening ranges.
• Algo Developers: Use plotted session bounds as logic for entry/exit filters.
• Liquidity Tracking: Identify common sweep behavior before/after session shifts.

Absorption DetectorABSORPTION DETECTOR -
The Absorption Detector identifies institutional order flow by detecting "absorption" patterns where smart money quietly accumulates or distributes positions by absorbing retail order flow. This creates high-probability support and resistance zones for trading. This is an approximation only and does not read any footprint data.
WHAT IS ABSORPTION?
Absorption occurs when institutions take the opposite side of retail trades, creating specific candlestick patterns with high volume and significant wicks. The indicator identifies two main patterns:
SELLING ABSORPTION (P-Pattern): Red zones above candles where institutions sell into retail buying pressure, creating resistance levels. Look for high volume candles with large upper wicks that close in the lower half.
BUYING ABSORPTION (B-Pattern): Green zones below candles where institutions buy from retail selling pressure, creating support levels. Look for high volume candles with large lower wicks that close in the upper half.
KEY FEATURES
- Automatic detection of institutional absorption patterns
- Dynamic support and resistance zone creation
- Customizable styling for all visual elements
- Historic zone display for backtesting analysis
- Strength-based filtering to show only high-probability setups
- Real-time alerts for new absorption patterns
- Professional info panel with key statistics
- Multi-timeframe compatibility
MAIN SETTINGS
Volume Threshold (1.2): Minimum volume surge required compared to average. Higher values = fewer but stronger signals.
Minimum Volume (2500): Absolute volume floor to prevent signals during low-volume periods.
Min Wick Size (0.2): Minimum wick size as ATR multiple. Ensures significant rejection occurred.
Minimum Strength (1.5): Combined volume and wick strength filter. Higher values = higher quality signals.
Show Historic Zones (OFF): Enable to see all historical zones for backtesting. Disable for better performance.
Zone Extension (20): How many bars to project zones forward for anticipating future reactions.
TRADING APPROACH
ZONE REACTION STRATEGY: Wait for price to approach absorption zones and trade the bounce or rejection. Use the zones as dynamic support and resistance levels.
BREAKOUT STRATEGY: Trade decisive breaks of strong absorption zones with proper risk management. Failed zones often lead to strong moves.
CONFLUENCE TRADING: Combine absorption zones with other technical analysis for highest probability setups. Look for alignment with trend lines, Fibonacci levels, and key support/resistance.
RISK MANAGEMENT: Always use stop losses beyond the absorption zones. Target minimum 1:2 risk-reward ratios. Position size appropriately based on zone strength.
OPTIMIZATION GUIDE
For Conservative Trading (fewer, higher quality signals):
- Volume Threshold: 1.5
- Minimum Strength: 2.0
- Min Wick Size: 0.3
For Aggressive Trading (more signals, requires careful filtering):
- Volume Threshold: 1.1
- Minimum Strength: 1.0
- Min Wick Size: 0.15
BEST PRACTICES
Markets: Works best on liquid instruments with good volume - major forex pairs, popular stocks, liquid futures, and established cryptocurrencies.
Timeframes: Effective on all timeframes from 1-minute scalping to daily swing trading. Adjust settings based on your timeframe and trading style.
Confirmation: Never trade absorption signals in isolation. Always combine with trend analysis, market structure, and proper risk management.
Session Timing: Be aware of market sessions and avoid trading during low liquidity periods or major news events.
Backtesting: Use the historic zones feature to validate performance on your chosen market and timeframe before live trading.
CUSTOMIZATION
The indicator offers complete visual customization including zone colors, border styles, label appearances, and info panel positioning. All colors can be adapted to match your chart theme and personal preferences.
Alert system provides both basic and custom message alerts for real-time notifications of new absorption patterns.
PERFORMANCE NOTES
Default settings are optimized for most markets and timeframes. For best performance on older charts, keep "Show Historic Zones" disabled unless specifically backtesting.
The indicator maintains excellent performance even with extensive historical analysis enabled, handling up to 500 zones and 100 labels for comprehensive backtesting.

Supply/Demand Zones with Midline (No Overlap Logic)Supply and demand formations based on inside bar breakouts. Automatically plots zones to buy and sell from. MTF analysis available.

通用經濟數據年增率 (YoY %)主要觀看經濟數據使用
可將主數據統計週期切換月度年增率或季度年增率
希望能幫到有在關注經濟數據但沒有年增率的網友們
The primary purpose is to view economic data. We can switch the statistical period to monthly year-over-year (YoY) growth or quarterly year-over-year (YoY) growth.
This is intended to assist users who follow economic data but lack access to year-over-year growth rates.

DCA by Vuong Thai v2 %verview of "DCA by Vuong Thai %" – Upgraded Version
Main Function:
This script automatically detects optimal DCA (Dollar-Cost Averaging) buy points and smart profit-taking zones based on a combination of technical signals: EMA, candlestick patterns, volume, RSI, and price distance from EMA.
It helps you optimize capital allocation using a structured averaging-down strategy and exit trades when a target price range is reached.
✅ Buy Logic (Buy Signal)
A buy signal is triggered when all of the following conditions are met:
Strong bullish candlestick: Green candle with a longer lower wick than upper wick
Price is below the EMA → indicating a downtrend
Volume is above the moving average (if volume filtering is enabled)
Price is at least a certain percentage below the EMA (e.g., ≥ 1%)
RSI is below 30 → indicating an oversold condition
No repeat buys unless price makes a new low → helps avoid premature entries
👉 When a buy signal appears:
A DCA Zone (buy region) is drawn on the chart
A label with the corresponding DCA percentage is displayed automatically (e.g., "DCA 5%", "DCA 10%")

Fibonacci Spectrum + Regression Channel + ConfirmationsA versatile multi-strategy tool for technical traders using Fibonacci levels, regression channels, and dynamic confirmations.
📘 Overview
This TradingView strategy script helps traders detect high-probability breakouts, reversals, and trend continuations using:
🔢 Fibonacci retracement zones
📉 Regression channels (local & multi-timeframe)
✅ Multiple confirmations (Volume, RSI, MACD, Candlestick)
🔄 Preset strategy modes (Trend-follow, Mean-reversion, Breakout, Custom)
📊 Visual dashboard for real-time analysis
🔔 Alerts for breakout and breakdown signals
🛠️ Inputs & Configuration
🎛️ Preset Modes
Choose from 4 trading modes:
Custom — manually enable/disable confirmations
Trend-follow — emphasizes RSI & MACD alignment
Mean-reversion — tight channels, ignores volume
Breakout — aggressive setup, tighter fib lookback & wider bands
🔧 Changing preset automatically adjusts parameters like regression length, fib lookback, and confirmation rules.
🔢 Fibonacci Settings
Fib Lookback: Number of bars to calculate the high/low range.
Fib Ratios A-E: Defines retracement levels (0.236 to 0.786 by default).
Zones are shaded for clarity:
🟧 0.236–0.382
🟨 0.382–0.5
🟩 0.5–0.618
🟦 0.618–0.786
📉 Regression Channel
Reg Channel Length: Period used for linear regression.
StdDev Multiplier: Defines channel width.
Multi-Timeframe Support: Choose a higher timeframe (like 1h) to overlay broader trends.
✅ Confirmations (toggle ON/OFF or preset controlled)
Volume: Must be above its 20-bar average.
RSI: Must be above 50 and rising (or below 50 and falling for shorts).
MACD: Line must cross above Signal (bull) or below (bear).
Candlestick Pattern: Looks for Bullish or Bearish Engulfing candles.
📅 Backtest Settings
Enable/disable strategy entries and exits for simulation.
Entries:
Long when price breaks above Fib 0.618 with all confirmations met
Short when price breaks below Fib 0.382 with all bearish confirmations
Exits:
Long exits when price breaks below Fib 0.382
Short exits when price breaks above Fib 0.618
🔍 How to Use the Strategy
🔹 Step 1: Choose a Preset
Pick one of the four Preset Modes:
Want to follow a trend? Select Trend-follow
Expect a price bounce? Try Mean-reversion
Expect volatility? Use Breakout
Prefer full control? Use Custom
🔹 Step 2: Enable Confirmations (if in Custom mode)
Activate/deactivate:
Volume
RSI
MACD
Candlestick Patterns
These filters increase signal quality.
🔹 Step 3: Watch for Signals
Look for:
💠 "READY" labels (potential breakout or breakdown)
Color-coded Fibonacci zones and channel bounds
📈 Entry/Exit signals (when backtesting is enabled)
🔹 Step 4: Use the Dashboard
Located in the top-right, the table shows:
Indicator values
Trend direction (Up/Down)
Status (Bull/Bear, High/Low, Above/Below)
Closest Fibonacci level and candlestick patterns
Colors:
🟢 Green = Bullish or Positive
🔴 Red = Bearish or Negative
🟡 Yellow = Close to a key Fib level
🔔 Alerts (Included)
You can set alerts on the following conditions:
Pre-Breakout — all bullish confirmations + Fib 0.618 cross
Pre-Breakdown — all bearish confirmations + Fib 0.382 break
Position Opened — any strategy entry (for backtest tracking)
To activate:
Right-click the chart → Add Alert
Select this strategy and the condition (e.g., “Pre-Breakout Signal”)
📊 Example Use Cases
🟢 Breakout Trader
Set to Breakout
Watch for “READY” label above Fib 0.618
Confirm with strong volume & bullish MACD
Alert triggers → enter trade
🔴 Mean Reversion Trader
Set to Mean-reversion
Price hits lower channel + Fib 0.382
Weak volume, but RSI rebounds → consider long
⚖️ Trend Follower
Set to Trend-follow
RSI, MACD, and price all moving up above midline
Enter on Fib 0.618 bounce
🧪 Tips & Notes
Combine with multi-timeframe analysis by enabling the MTF Channel
Tweak Fib ratios if you're using alternative levels (e.g., 0.886)
Use strategy.percent_of_equity for dynamic position sizing in backtests
Set proper timeframes (e.g., 15m, 1h) based on your trading style
Not financial advice at all. Strategy still WIP, i mainly think the indicator is ready.

Key Levels Cheat Sheet🎯 Overview
The Key Levels Cheat Sheet is a comprehensive TradingView indicator that displays 25+ critical price levels in a clean, organized table format. Inspired by professional trading platforms, this indicator eliminates chart clutter by
consolidating all essential support and resistance levels into a single, real-time updating reference table.
Perfect for day traders, swing traders, and scalpers who need instant visibility of key levels without drawing multiple lines on their charts.
📊 Features
Volume-Based Levels
- Session VWAP - Current day's volume weighted average price
- Weekly VWAP - Longer-term institutional trading level
- VWAP Bands (1σ, 2σ, 3σ) - Standard deviation bands showing price extension levels
Session-Based Levels (ICT Concepts)
- True Day Open - Midnight EST opening (ICT methodology)
- Futures Session Open - 6 PM EST futures market open
- Asia Session (9 PM - 1 AM EST) - Asian market high/low
- London Session (3 AM - 6 AM EST) - European market high/low
- NY AM Session (9:30 AM - 11 AM EST) - New York morning high/low
- NY PM Session (1:30 PM - 4 PM EST) - New York afternoon high/low
- Opening Range - Customizable 5/15/30-minute opening range
Historical Levels
- Prior Day/Week/Month - Previous period high/low levels
- 52-Week High/Low - Yearly extremes
- All-Time High/Low - Historical extremes
- Current Day High/Low - Today's range
Smart Money Structure
- Advanced Swing Detection - Market structure-based swing highs/lows
- Swept Range Detection - Automatically hides mitigated levels
- Real-Time Updates - Dynamic level detection
Technical Indicators
- EMAs (9, 21, 50) - Exponential moving averages
- SMAs (20, 50, 200) - Simple moving averages
Expected Move Calculation
- VIX-Based Range - Live VIX data integration
- Multiple Anchors - Calculate from True Day Open, NY Open, or Session Start
- Options Trading - Perfect for probability-based strategies
🎨 Display Features
Smart Table Design
- Auto-Sorting - Levels sorted from highest to lowest
- Color Coding - Green above price, red below price
- Distance Display - Shows percentage or points from current price
- 9 Position Options - Place table anywhere on chart
- Customizable Size - Adjustable text and opacity
Intelligent Filtering
- Hide Swept Ranges - Automatically removes broken levels
- Toggle Individual Levels - Show only what you need
- Clean Interface - No chart clutter
💡 Use Cases
Day Trading
- Track key intraday levels without cluttering charts
- Monitor session highs/lows for breakout trades
- Use VWAP and bands for mean reversion
- Opening range breakout strategies
Swing Trading
- Monitor weekly/monthly levels for position entries
- Track 52-week highs/lows for momentum plays
- Use prior period levels for support/resistance
Options Trading
- VIX-based expected move for strike selection
- Probability zones for credit spreads
- Key levels for pin risk assessment
Scalping
- Quick reference for immediate support/resistance
- VWAP bands for quick reversals
- Session levels for range trading
📚 Educational Value
Every setting includes detailed tooltips explaining:
- ICT (Inner Circle Trader) concepts
- Session trading strategies
- VWAP and standard deviation usage
- Expected move calculations
- Smart money structure
Perfect for traders learning advanced concepts while getting practical trading levels.
⚙️ Customization
Smart Defaults
- Essential levels enabled by default
- Less common levels disabled to reduce clutter
- Swept range hiding enabled for clean display
Full Control
- Toggle any level on/off
- Choose percentage or points display
- Adjust table position and appearance
- Customize for your trading style
🚀 Getting Started
1. Add to Chart - Works on any timeframe and instrument
2. Position Table - Choose from 9 positions
3. Enable Levels - Turn on levels relevant to your strategy
4. Start Trading - All levels update in real-time
📈 Why Use This Indicator?
- Save Time - No more drawing levels manually
- Stay Organized - All levels in one place
- Trade Better - Never miss a key level
- Learn Concepts - Educational tooltips included
- Professional Tool - Institutional-grade level tracking
🎓 Tips for Best Results
- Use on 1-15 minute charts for day trading
- Enable session levels for futures/forex trading
- Use expected move for options strategies
- Combine with your existing strategy for confluence
- Hide swept ranges to focus on active levels
---
The Key Levels Cheat Sheet transforms how you view and use support/resistance levels. Stop cluttering your charts with lines and start trading with clarity.
Tags: #levels #support #resistance #vwap #sessions #daytrading #scalping #options #expectedmove #smartmoney #ict #tradingview
