OPEN-SOURCE SCRIPT
已更新 Kaufman Efficiency Ratio-Based Risk Percentage
OVERVIEW
The Kaufman Efficiency Ratio-Based Exposure Management indicator uses the Kaufman Efficiency Ratio (KER) to calculate how much you should risk per trade.
If KER is high, then the indicator will tell you to risk more per trade.
If KER is low, then the indicator will tell you to risk less per trade.
CONCEPTS
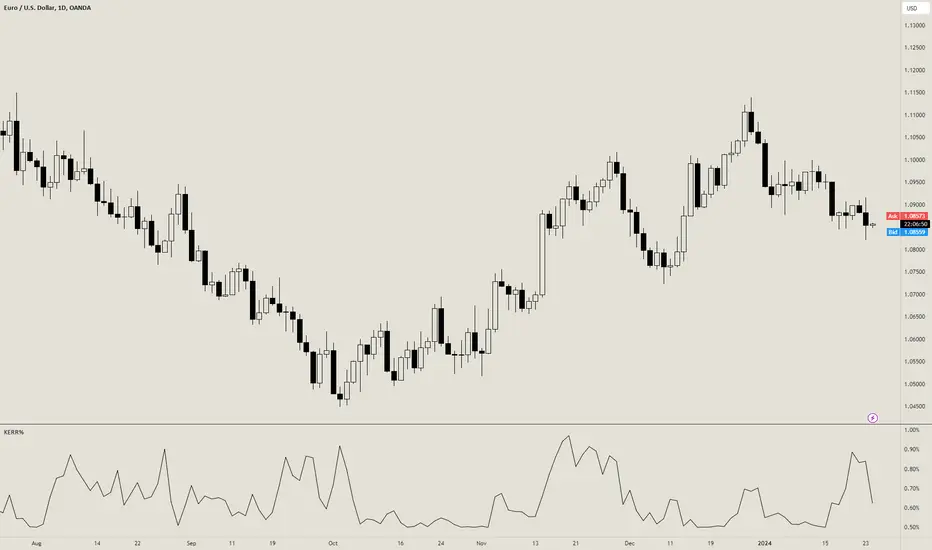
The Kaufman Efficiency Ratio (also known as the Efficiency Ratio, KER, or ER) is a separate indicator developed by Perry J. Kaufman and first published in Kaufman's book, "New Trading Systems and Methods" in 1987.
The KER used to measure the efficiency of a financial instrument's price movement. It is calculated as follows:
KER = (change in price over x bars) / (sum of absolute price changes over x bars)
The first part of the formula, "change in price over x bars" measures the difference between the current close price and the close price x bars ago. The second part of the formula "sum of absolute price changes over x bars" measures the sum of the |open-close| range of each bar between now and x bars ago.
If there is a high change in price over x bars relative to the sum of absolute price changes over x bars, a trending/volatile market is likely in place.
If there is a low change in price over x bars relative to the sum of absolute price changes over x bars, a ranging/choppy market is likely in place.
If you are a trend trader, you can assume that entries taken during high KER periods are more likely to lead to a trend. This indicator helps capitalize on that assumption by increasing risk % per trade during high KER periods, and decreasing risk % per trade during low KER periods.
It uses the following formulas to calculate a KER-adjusted risk % per trade:
min risk = the smallest amount you'd be willing to risk on a trade
max risk = the largest amount you'd be willing to risk on a trade
KER = the current Kaufman Efficiency Ratio value
n = an exponent factor used to control the rate of increase of the risk %
Here is an example of how these formulas work:
Assuming that min risk is 0.5%, max risk is 2%, and KER is 0.8 (indicating a trending market), we can calculate the following risk per trade amounts:
Now, lets do the same calculations with a lower KER of 0.2, which indicates a choppy market:
With a high KER, we risk more per trade to capitalize on the higher chance of a trending market. With a lower KER, we risk less per trade to protect ourselves from the higher chance of a choppy market.
The Kaufman Efficiency Ratio-Based Exposure Management indicator uses the Kaufman Efficiency Ratio (KER) to calculate how much you should risk per trade.
If KER is high, then the indicator will tell you to risk more per trade.
- A high KER value indicates a trending market, so if you are a trend trader, it makes sense to risk more during these times.
If KER is low, then the indicator will tell you to risk less per trade.
- A low KER value indicates a trending market, so if you are a trend trader, it makes sense to risk less during these times.
CONCEPTS
The Kaufman Efficiency Ratio (also known as the Efficiency Ratio, KER, or ER) is a separate indicator developed by Perry J. Kaufman and first published in Kaufman's book, "New Trading Systems and Methods" in 1987.
The KER used to measure the efficiency of a financial instrument's price movement. It is calculated as follows:
KER = (change in price over x bars) / (sum of absolute price changes over x bars)
The first part of the formula, "change in price over x bars" measures the difference between the current close price and the close price x bars ago. The second part of the formula "sum of absolute price changes over x bars" measures the sum of the |open-close| range of each bar between now and x bars ago.
If there is a high change in price over x bars relative to the sum of absolute price changes over x bars, a trending/volatile market is likely in place.
If there is a low change in price over x bars relative to the sum of absolute price changes over x bars, a ranging/choppy market is likely in place.
If you are a trend trader, you can assume that entries taken during high KER periods are more likely to lead to a trend. This indicator helps capitalize on that assumption by increasing risk % per trade during high KER periods, and decreasing risk % per trade during low KER periods.
It uses the following formulas to calculate a KER-adjusted risk % per trade:
- Linearly-increasing risk % = min risk + (KER * (max risk - min risk))
- Exponentially-increasing risk % = min risk + ((KER^n) * (max risk - min risk))
min risk = the smallest amount you'd be willing to risk on a trade
max risk = the largest amount you'd be willing to risk on a trade
KER = the current Kaufman Efficiency Ratio value
n = an exponent factor used to control the rate of increase of the risk %
Here is an example of how these formulas work:
Assuming that min risk is 0.5%, max risk is 2%, and KER is 0.8 (indicating a trending market), we can calculate the following risk per trade amounts:
- Linearly-increasing risk % = 0.5 + (0.8 * (2 - 0.5)) = 1.7%
- Exponentially-increasing risk % = 0.5 + ((0.8^3) * (2 - 0.5)) = 1.27%
Now, lets do the same calculations with a lower KER of 0.2, which indicates a choppy market:
- Linearly-increasing risk % = 0.5 + (0.2 * (2 - 0.5)) = 0.8%
- Exponentially-increasing risk % = 0.5 + ((0.2^3) * (2 - 0.5)) = 0.51%
With a high KER, we risk more per trade to capitalize on the higher chance of a trending market. With a lower KER, we risk less per trade to protect ourselves from the higher chance of a choppy market.
發行說明
Minor cosmetic changes in input settings發行說明
Added option to invert the indicator's calculation.開源腳本
秉持TradingView一貫精神,這個腳本的創作者將其設為開源,以便交易者檢視並驗證其功能。向作者致敬!您可以免費使用此腳本,但請注意,重新發佈代碼需遵守我們的社群規範。
免責聲明
這些資訊和出版物並非旨在提供,也不構成TradingView提供或認可的任何形式的財務、投資、交易或其他類型的建議或推薦。請閱讀使用條款以了解更多資訊。
免責聲明
這些資訊和出版物並非旨在提供,也不構成TradingView提供或認可的任何形式的財務、投資、交易或其他類型的建議或推薦。請閱讀使用條款以了解更多資訊。