OPEN-SOURCE SCRIPT
Volume Weighted Average Price Band Extension
## Volume Weighted Average Price Band Extension (VWAPb)
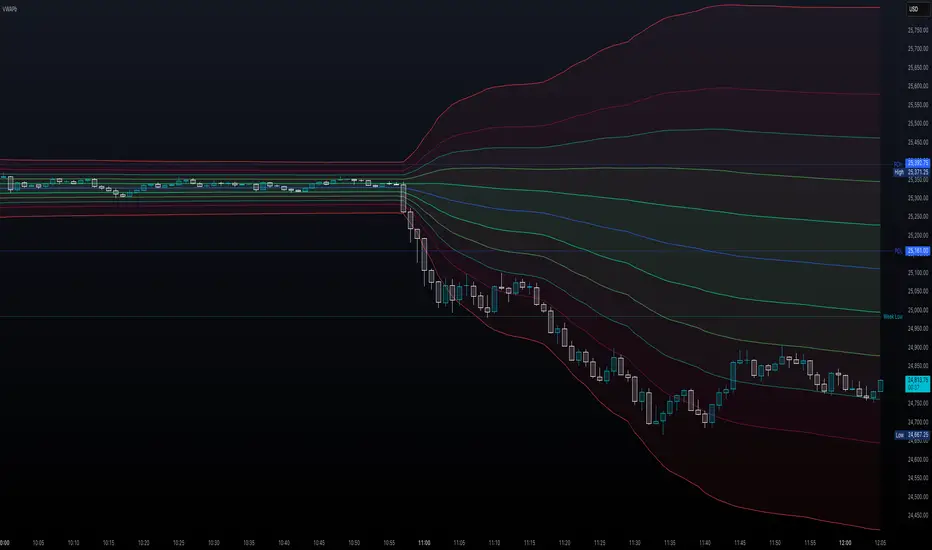
**Volume Weighted Average Price Band Extension** is an enhanced VWAP indicator that extends the traditional three-band system to include up to **five configurable standard deviation bands**, making it particularly well-suited for analyzing volatile market conditions where price action frequently extends beyond conventional boundaries.
### Key Features
**Extended Band System**
Unlike standard VWAP indicators that typically offer three bands, this indicator provides five independently configurable bands with customizable multipliers (default: 0.5x, 1.0x, 1.5x, 2.0x, and 3.0x). Each band can be toggled on or off, allowing traders to adapt the display to current market volatility and their specific trading strategy.
**Dual Calculation Modes**
The indicator offers flexibility in how bands are calculated:
- **Standard Deviation Mode**: Traditional statistical approach measuring price dispersion from the VWAP
- **Percentage Mode**: Distance calculated as a percentage of VWAP (1 multiplier = 1%), useful for comparing relative moves across different price levels
**Flexible Anchor Periods**
Calculate VWAP from multiple timeframes and events:
- Time-based: Session, Week, Month, Quarter, Year, Decade, Century
- Event-based: Earnings reports, Dividend announcements, Stock splits
- Customizable source (default: hlc3)
**Visual Clarity**
Color-coded bands with semi-transparent fills between upper and lower boundaries help identify key support and resistance zones at a glance. The indicator automatically hides on daily and higher timeframes when enabled, keeping charts clean.
### Ideal For
- **Volatile Markets**: The extended band system captures extreme price movements that often exceed traditional 2-3 standard deviation bounds
- **Scalping & Day Trading**: Multiple bands provide granular entry and exit zones for short-term trades
- **Mean Reversion Strategies**: Identify overextended price action relative to volume-weighted fair value
- **Institutional Order Flow Analysis**: VWAP remains a key benchmark for institutional execution
### How It Works
The Volume Weighted Average Price represents the average price weighted by volume throughout the selected anchor period. The surrounding bands act as dynamic support and resistance levels, with each successive band representing areas of increasing deviation from the volume-weighted mean. In volatile conditions, price may regularly test the outer bands (2.0x, 3.0x), which would be invisible on standard three-band implementations.
**Trading Applications:**
- Price near outer bands (±2.0x, ±3.0x) may signal exhaustion and potential reversal opportunities
- Price oscillating between inner bands (±0.5x, ±1.0x) indicates consolidation
- VWAP itself acts as a dynamic pivot point—bullish above, bearish below
### Settings Overview
- **VWAP Settings**: Anchor period selection, source input, offset capability, option to hide on D/W/M timeframes
- **Bands Settings**: Toggle each of the five bands independently, adjust multipliers, choose between Standard Deviation or Percentage calculation mode
---
**Note**: This indicator requires volume data to function properly. A runtime error will display if volume data is unavailable for the selected symbol.
**Disclaimer**: This indicator is designed for technical analysis and should be used in conjunction with other forms of analysis and proper risk management. Past performance and indicator signals do not guarantee future results.
開源腳本
秉持TradingView一貫精神,這個腳本的創作者將其設為開源,以便交易者檢視並驗證其功能。向作者致敬!您可以免費使用此腳本,但請注意,重新發佈代碼需遵守我們的社群規範。
免責聲明
這些資訊和出版物並非旨在提供,也不構成TradingView提供或認可的任何形式的財務、投資、交易或其他類型的建議或推薦。請閱讀使用條款以了解更多資訊。
免責聲明
這些資訊和出版物並非旨在提供,也不構成TradingView提供或認可的任何形式的財務、投資、交易或其他類型的建議或推薦。請閱讀使用條款以了解更多資訊。