OPEN-SOURCE SCRIPT
已更新 Multi TimeFrame OHLC Overlay @MaxMaserati
Multi TimeFrame OHLC Overlay MaxMaserati
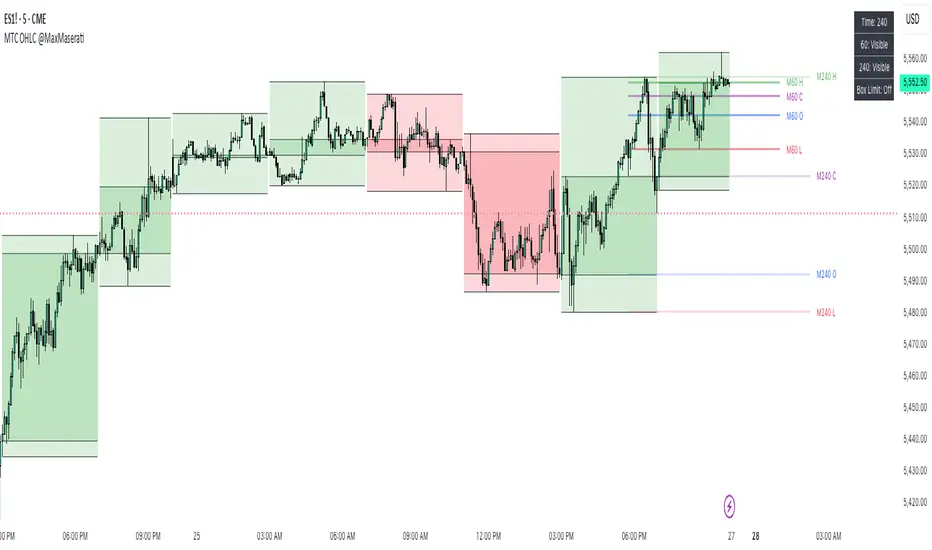
A powerful and versatile indicator that displays OHLC (Open, High, Low, Close) data across multiple timeframes with enhanced visualization features. Perfect for traders who need to analyze price action across different time periods simultaneously.
Key Features:
Customizable multi-timeframe OHLC visualization with box and line overlays
Extended OHLC lines from higher timeframes with clear labeling
Distinct bullish and bearish candle representations
Fully configurable color schemes and display options
Real-time timeframe information display
Main Components:
Multi-Timeframe Display
Primary timeframe OHLC visualization with boxes and lines
Extended timeframe overlay for broader market context
Clear visual distinction between timeframes
Customizable Visuals
Separate color settings for bullish and bearish patterns
Adjustable transparency for both body and wick components
Configurable OHLC line colors and visibility
Extended Lines Features
Higher timeframe OHLC level overlay
Custom labels with timeframe identification
Adjustable line properties and visibility
Information Display
Current timeframe indicator
Extended timeframe reference
Clean and unobtrusive interface
Settings Groups:
Extended OHLC Lines
Labels Options
Display Options
Bullish/Bearish Candle Settings
OHLC Lines Configuration
Usage Tips:
Start with the default 240-minute timeframe or adjust to your preferred interval
Use the extended lines feature to view higher timeframe levels
Customize colors and transparency to match your chart theme
Enable/disable specific components based on your analysis needs
Perfect For:
Multi-timeframe analysis
Support/Resistance identification
Price action trading
Trend following strategies
Market structure analysis
This indicator combines powerful multi-timeframe analysis capabilities with clean visualization, making it an essential tool for traders who need to maintain awareness of price action across different time periods.
Note:
For optimal performance, adjust the visual settings according to your chart's timeframe and color scheme. The indicator is designed to work seamlessly across all trading instruments and timeframes.
發行說明
- Update to V6- Fix an issue to several current lines showing in LTF's
發行說明
- Toggle box added to see the last closed box發行說明
- Added spaces between timeframe prefix and OHLC label (e.g., "M240 O" instead of "M240O")- Implemented conditional display of two timeframes:
1-hour timeframe visible when chart is ≤ 5 minutes
4-hour timeframe visible when chart is ≤ 15 minutes
- Different colors for each timeframe added
- Visibility status in panel
- Offset the second timeframe labels to prevent overlap with first timeframe labels
開源腳本
秉持TradingView一貫精神,這個腳本的創作者將其設為開源,以便交易者檢視並驗證其功能。向作者致敬!您可以免費使用此腳本,但請注意,重新發佈代碼需遵守我們的社群規範。
MMM : No body close (PO4), No Trade.
免責聲明
這些資訊和出版物並非旨在提供,也不構成TradingView提供或認可的任何形式的財務、投資、交易或其他類型的建議或推薦。請閱讀使用條款以了解更多資訊。
開源腳本
秉持TradingView一貫精神,這個腳本的創作者將其設為開源,以便交易者檢視並驗證其功能。向作者致敬!您可以免費使用此腳本,但請注意,重新發佈代碼需遵守我們的社群規範。
MMM : No body close (PO4), No Trade.
免責聲明
這些資訊和出版物並非旨在提供,也不構成TradingView提供或認可的任何形式的財務、投資、交易或其他類型的建議或推薦。請閱讀使用條款以了解更多資訊。