OPEN-SOURCE SCRIPT
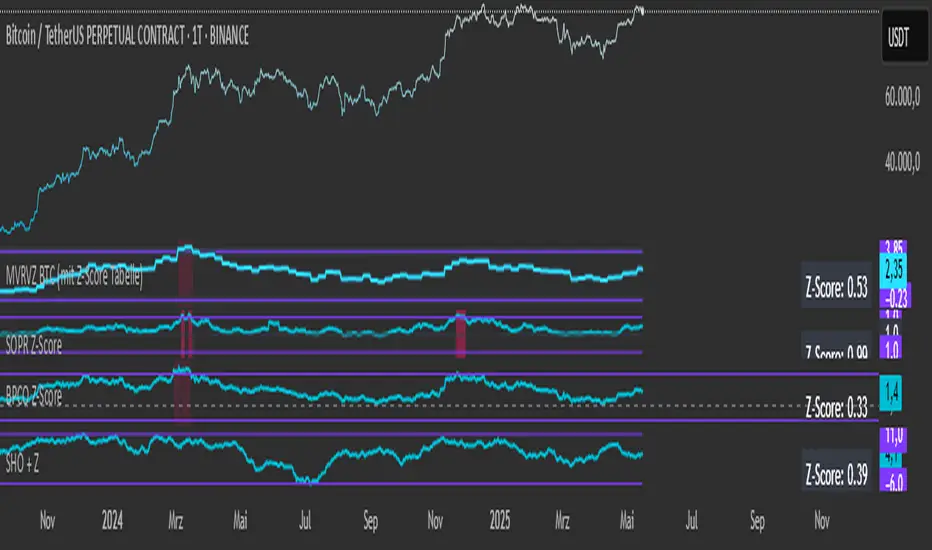
Simplified Hashrate Oscillator + Z-Score

Indicator Description for TradingView
Simplified Hashrate Oscillator + Z-Score (SHO + Z)
This indicator analyzes the Bitcoin network's mining hashrate data by comparing short-term and long-term moving averages of the hashrate to create an oscillator that reflects changes in mining activity.
How it works:
The indicator calculates two Simple Moving Averages (SMAs) of the Bitcoin network hashrate — a short-term SMA (default 21 days) and a long-term SMA (default 105 days).
The difference between these two averages is normalized and expressed as a percentage, forming the Hashrate Oscillator line.
Two user-defined threshold lines (default ±7%) are plotted as upper and lower reference levels on the oscillator.
When the oscillator approaches these levels, it indicates potential extremes in mining activity.
Z-Score Explanation:
The Z-Score is a normalized measure that translates the oscillator's current value into a standardized scale roughly ranging from -2 to +2.
It shows how far the current hashrate oscillator value deviates from the user-defined thresholds.
A Z-Score near +2 means the oscillator is close to or above the upper threshold (possible overbought conditions).
A Z-Score near -2 means the oscillator is near or below the lower threshold (possible oversold conditions).
This helps users assess the relative strength or weakness of the mining hashrate movement in a normalized context.
Data Source:
The hashrate data is sourced daily from the Bitcoin network hashrate dataset provided by Quandl (QUANDL:BCHAIN/HRATE), a reliable blockchain data provider.
The indicator requests daily hashrate values and calculates SMAs accordingly.
How to use:
Watch the Hashrate Oscillator line for movements towards or beyond the threshold lines as signals of miner capitulation or recovery phases.
Use the Z-Score displayed in the table to quickly gauge how extreme the current reading is relative to set thresholds.
Adjust the short and long SMA periods and threshold lines to suit your preferred sensitivity and trading timeframe.
開源腳本
秉持TradingView一貫精神,這個腳本的創作者將其設為開源,以便交易者檢視並驗證其功能。向作者致敬!您可以免費使用此腳本,但請注意,重新發佈代碼需遵守我們的社群規範。
免責聲明
這些資訊和出版物並非旨在提供,也不構成TradingView提供或認可的任何形式的財務、投資、交易或其他類型的建議或推薦。請閱讀使用條款以了解更多資訊。
開源腳本
秉持TradingView一貫精神,這個腳本的創作者將其設為開源,以便交易者檢視並驗證其功能。向作者致敬!您可以免費使用此腳本,但請注意,重新發佈代碼需遵守我們的社群規範。
免責聲明
這些資訊和出版物並非旨在提供,也不構成TradingView提供或認可的任何形式的財務、投資、交易或其他類型的建議或推薦。請閱讀使用條款以了解更多資訊。