OPEN-SOURCE SCRIPT
Treasury Yield Spread 10y-2y [TXMC]
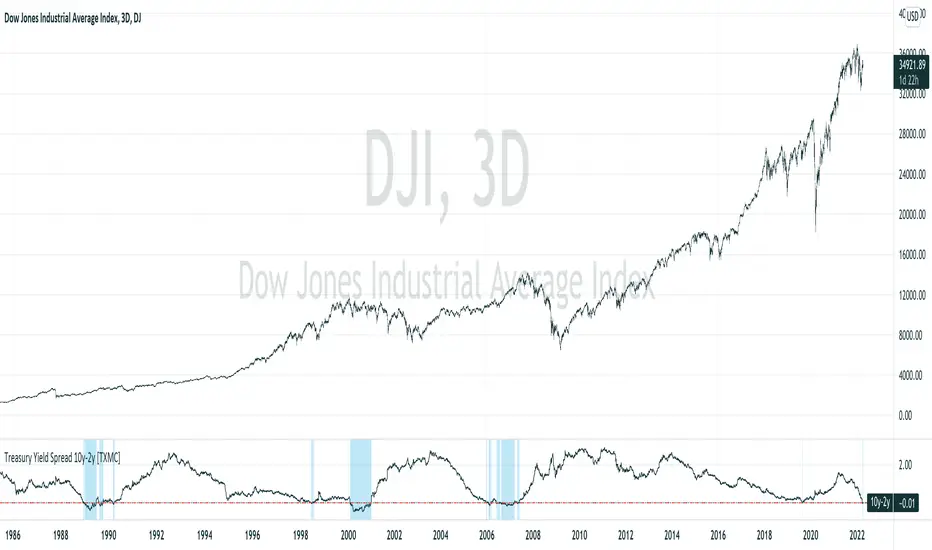
A simple indicator to show inversions of the US Treasury yield curve, specifically between the 2yr and 10yr yields.
A colored band prints when the 2yr treasury yield surpasses the 10yr, indicating an inversion of the yield curve.
This indicator is for educational purposes only.
A colored band prints when the 2yr treasury yield surpasses the 10yr, indicating an inversion of the yield curve.
This indicator is for educational purposes only.
開源腳本
秉持TradingView一貫精神,這個腳本的創作者將其設為開源,以便交易者檢視並驗證其功能。向作者致敬!您可以免費使用此腳本,但請注意,重新發佈代碼需遵守我們的社群規範。
免責聲明
這些資訊和出版物並非旨在提供,也不構成TradingView提供或認可的任何形式的財務、投資、交易或其他類型的建議或推薦。請閱讀使用條款以了解更多資訊。
免責聲明
這些資訊和出版物並非旨在提供,也不構成TradingView提供或認可的任何形式的財務、投資、交易或其他類型的建議或推薦。請閱讀使用條款以了解更多資訊。