Hello everyone <3
I present to you guys my new indicator Volume per Point (VP)
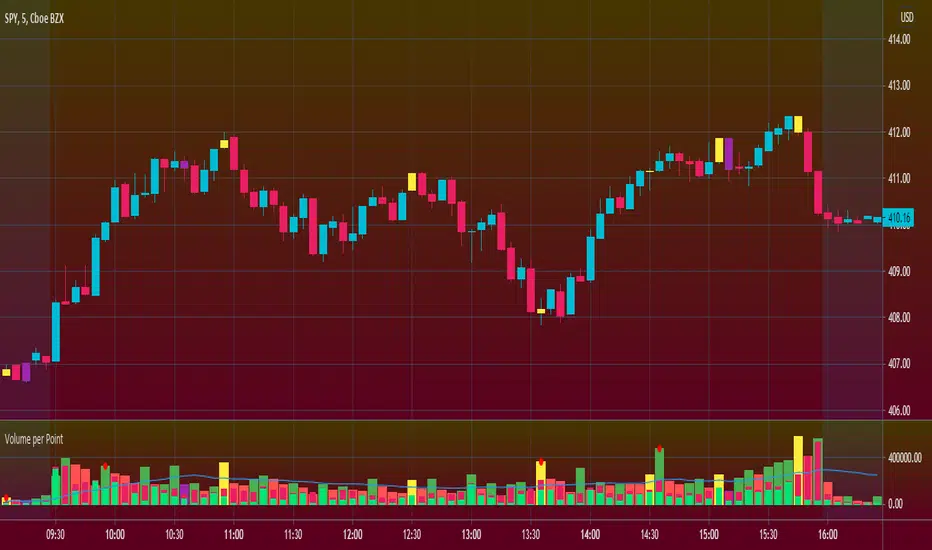
As suggested by the title, this script gives you the volume for every point.
Here's a run down on specific features:
SUBCHART COLUMNS:
The columns can be the following four colors:
Green - There was an increase in VP
Red - There was a decrease in VP
Yellow - There was divergence between volume and candle range
Purple - There are signs of exhaustion compared to the previous candlestick
SUBCHART HISTOGRAM:
The histogram can be the following two colors:
Lime - Buying volume
Red - Selling volume
I left you guys the ability to change the multiplier on the volume in settings just incase it's too small or too big compared to the VP. Decimals are allowed!
CANDLESTICK CHART:
The candlesticks can the following two colors:
Yellow - There was a divergence between volume and candle range
Purple - There are signs of exhaustion compared to the previous candlestick
FILTERS
In the settings, you're able to add the following two filters:
RSI Filters - RSI must be below or above the specified value for the divergence or exhaustion to trigger
Percent Filters - The candlestick range or volume must be higher or lower than the specified value depending whether it's divergence or exhaustion.
This is a very helpful tool if you're interesting in reading volume. It also facilitates finding market maker activity depending on the size of the VP. Sudden abnormal spikes in VP usually do signal something and that's up for you to figure out :)
Thank you for your time to read this
~July <3
I present to you guys my new indicator Volume per Point (VP)
As suggested by the title, this script gives you the volume for every point.
Here's a run down on specific features:
SUBCHART COLUMNS:
The columns can be the following four colors:
Green - There was an increase in VP
Red - There was a decrease in VP
Yellow - There was divergence between volume and candle range
Purple - There are signs of exhaustion compared to the previous candlestick
SUBCHART HISTOGRAM:
The histogram can be the following two colors:
Lime - Buying volume
Red - Selling volume
I left you guys the ability to change the multiplier on the volume in settings just incase it's too small or too big compared to the VP. Decimals are allowed!
CANDLESTICK CHART:
The candlesticks can the following two colors:
Yellow - There was a divergence between volume and candle range
Purple - There are signs of exhaustion compared to the previous candlestick
FILTERS
In the settings, you're able to add the following two filters:
RSI Filters - RSI must be below or above the specified value for the divergence or exhaustion to trigger
Percent Filters - The candlestick range or volume must be higher or lower than the specified value depending whether it's divergence or exhaustion.
This is a very helpful tool if you're interesting in reading volume. It also facilitates finding market maker activity depending on the size of the VP. Sudden abnormal spikes in VP usually do signal something and that's up for you to figure out :)
Thank you for your time to read this
~July <3
發行說明
Changes:- By default, volume is now disabled
- Now adds a red dot to the subchart column if there it detects an abnormal spike
You can re-enable volume and change the tolerance level for abnormal spikes via the "Multipliers" section in the settings :)
開源腳本
秉持TradingView一貫精神,這個腳本的創作者將其設為開源,以便交易者檢視並驗證其功能。向作者致敬!您可以免費使用此腳本,但請注意,重新發佈代碼需遵守我們的社群規範。
免責聲明
這些資訊和出版物並非旨在提供,也不構成TradingView提供或認可的任何形式的財務、投資、交易或其他類型的建議或推薦。請閱讀使用條款以了解更多資訊。
免責聲明
這些資訊和出版物並非旨在提供,也不構成TradingView提供或認可的任何形式的財務、投資、交易或其他類型的建議或推薦。請閱讀使用條款以了解更多資訊。