OPEN-SOURCE SCRIPT
ChillLax Relative Strength Line with NewHigh NewLow Blue Dot
This is similar to the IBD MarketSurge (MarketSmith) Blue Dot:
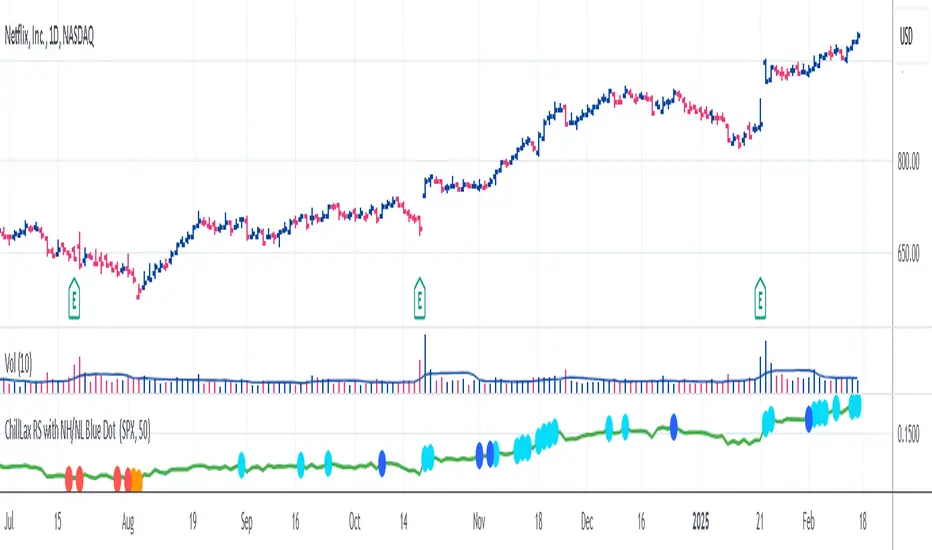
This plots the Relative Strength line vs. an index (default index is SPX), with a Dot when the RS line is hitting a New High.
If the RS hits a New High over the past X bars (default is 50), it shows a Light Blue (user definable) Dot on the RS line, if RS hits New High before the instrument hits New High, it shows a bigger/darker Blue Dot. Reverse for New Lows (orange for RS NL, Red for RS NL before Price NL)
This Dot is similar to the IBD Marketsurge RS New High Blue Dot, this indicator shows all the previous dots (MarketSurge shows only the last one). This on, unlike IBD, also shows RS New Lows. This one distinguishes RS NH before Price NH, and RS NL before Price NL. Lastly, IBD's lookback period is 52 week, here it is default to 50 days, but it is changeable.
開源腳本
秉持TradingView一貫精神,這個腳本的創作者將其設為開源,以便交易者檢視並驗證其功能。向作者致敬!您可以免費使用此腳本,但請注意,重新發佈代碼需遵守我們的社群規範。
免責聲明
這些資訊和出版物並非旨在提供,也不構成TradingView提供或認可的任何形式的財務、投資、交易或其他類型的建議或推薦。請閱讀使用條款以了解更多資訊。
開源腳本
秉持TradingView一貫精神,這個腳本的創作者將其設為開源,以便交易者檢視並驗證其功能。向作者致敬!您可以免費使用此腳本,但請注意,重新發佈代碼需遵守我們的社群規範。
免責聲明
這些資訊和出版物並非旨在提供,也不構成TradingView提供或認可的任何形式的財務、投資、交易或其他類型的建議或推薦。請閱讀使用條款以了解更多資訊。