RifleShooterLibLibrary "RifleShooterLib"
Provides a collection of helper functions in support of the Rifle Shooter Indicators.
Functions support the key components of the Rifle Trade algorithm including
* measuring momentum
* identifying paraboloic price action (to disable the algorthim during such time)
* determine the lookback criteria of X point movement in last N minutes
* processing and navigating between the 23/43/73 levels
* maintaining a status table of algorithm progress
toStrRnd(val, digits)
Parameters:
val (float)
digits (int)
_isValidTimeRange(startTimeInput, endTimeInput)
Parameters:
startTimeInput (string)
endTimeInput (string)
_normalize(_src, _min, _max)
_normalize Normalizes series with unknown min/max using historical min/max.
Parameters:
_src (float) : Source series to normalize
_min (float) : minimum value of the rescaled series
_max (float) : maximum value of the rescaled series
Returns: The series scaled with values between min and max
arrayToSeries(arrayInput)
arrayToSeries Return an array from the provided series.
Parameters:
arrayInput (array) : Source array to convert to a series
Returns: The array as a series datatype
f_parabolicFiltering(_activeCount, long, shooterRsi, shooterRsiLongThreshold, shooterRsiShortThreshold, fiveMinuteRsi, fiveMinRsiLongThreshold, fiveMinRsiShortThreshold, shooterRsiRoc, shooterRsiRocLongThreshold, shooterRsiRocShortThreshold, quickChangeLookbackBars, quckChangeThreshold, curBarChangeThreshold, changeFromPrevBarThreshold, maxBarsToholdParabolicMoveActive, generateLabels)
f_parabolicFiltering Return true when price action indicates a parabolic active movement based on the provided inputs and thresholds.
Parameters:
_activeCount (int)
long (bool)
shooterRsi (float)
shooterRsiLongThreshold (float)
shooterRsiShortThreshold (float)
fiveMinuteRsi (float)
fiveMinRsiLongThreshold (float)
fiveMinRsiShortThreshold (float)
shooterRsiRoc (float)
shooterRsiRocLongThreshold (float)
shooterRsiRocShortThreshold (float)
quickChangeLookbackBars (int)
quckChangeThreshold (int)
curBarChangeThreshold (int)
changeFromPrevBarThreshold (int)
maxBarsToholdParabolicMoveActive (int)
generateLabels (bool)
rsiValid(rsi, buyThreshold, sellThreshold)
rsiValid Returns true if the provided RSI value is withing the associated threshold. For the unused threshold set it to na
Parameters:
rsi (float)
buyThreshold (float)
sellThreshold (float)
squezeBands(source, length)
squezeBands Returns the squeeze bands momentum color of current source series input
Parameters:
source (float)
length (int)
f_momentumOscilator(source, length, transperency)
f_momentumOscilator Returns the squeeze pro momentum value and bar color states of the series input
Parameters:
source (float)
length (int)
transperency (int)
f_getLookbackExtreme(lowSeries, highSeries, lbBars, long)
f_getLookbackExtreme Return the highest high or lowest low over the look back window
Parameters:
lowSeries (float)
highSeries (float)
lbBars (int)
long (bool)
f_getInitialMoveTarget(lbExtreme, priveMoveOffset, long)
f_getInitialMoveTarget Return the point delta required to achieve an initial rifle move (X points over Y lookback)
Parameters:
lbExtreme (float)
priveMoveOffset (int)
long (bool)
isSymbolSupported(sym)
isSymbolSupported Return true if provided symbol is one of the supported DOW Rifle Indicator symbols
Parameters:
sym (string)
getBasePrice(price)
getBasePrice Returns integer portion of provided float
Parameters:
price (float)
getLastTwoDigitsOfPrice(price)
getBasePrice Returns last two integer numerals of provided float value
Parameters:
price (float)
getNextLevelDown(price, lowestLevel, middleLevel, highestLevel)
getNextLevelDown Returns the next level above the provided price value
Parameters:
price (float)
lowestLevel (float)
middleLevel (float)
highestLevel (float)
getNextLevelUp(price, lowestLevel, middleLevel, highestLevel)
getNextLevelUp Returns the next level below the provided price value
Parameters:
price (float)
lowestLevel (float)
middleLevel (float)
highestLevel (float)
isALevel(price, lowestLevel, middleLevel, highestLevel)
isALevel Returns true if the provided price is onve of the specified levels
Parameters:
price (float)
lowestLevel (float)
middleLevel (float)
highestLevel (float)
getClosestLevel(price, lowestLevel, middleLevel, highestLevel)
getClosestLevel Returns the level closest to the price value provided
Parameters:
price (float)
lowestLevel (float)
middleLevel (float)
highestLevel (float)
f_fillSetupTableCell(_table, _col, _row, _text, _bgcolor, _txtcolor, _text_size)
f_fillSetupTableCell Helper function to fill a setup table celll
Parameters:
_table (table)
_col (int)
_row (int)
_text (string)
_bgcolor (color)
_txtcolor (color)
_text_size (string)
f_fillSetupTableRow(_table, _row, _col0Str, _col1Str, _col2Str, _bgcolor, _textColor, _textSize)
f_fillSetupTableRow Helper function to fill a setup table row
Parameters:
_table (table)
_row (int)
_col0Str (string)
_col1Str (string)
_col2Str (string)
_bgcolor (color)
_textColor (color)
_textSize (string)
f_addBlankRow(_table, _row)
f_addBlankRow Helper function to fill a setup table row with empty values
Parameters:
_table (table)
_row (int)
f_updateVersionTable(versionTable, versionStr, versionDateStr)
f_updateVersionTable Helper function to fill the version table with provided values
Parameters:
versionTable (table)
versionStr (string)
versionDateStr (string)
f_updateSetupTable(_table, parabolicMoveActive, initialMoveTargetOffset, initialMoveAchieved, shooterRsi, shooterRsiValid, rsiRocEnterThreshold, shooterRsiRoc, fiveMinuteRsi, fiveMinuteRsiValid, requireValid5MinuteRsiForEntry, stallLevelOffset, stallLevelExceeded, stallTargetOffset, recoverStallLevelValid, curBarChangeValid, volumeRoc, volumeRocThreshold, enableVolumeRocForTrigger, tradeActive, entryPrice, curCloseOffset, curSymCashDelta, djiCashDelta, showDjiDelta, longIndicator, fontSize)
f_updateSetupTable Manages writing current data to the setup table
Parameters:
_table (table)
parabolicMoveActive (bool)
initialMoveTargetOffset (float)
initialMoveAchieved (bool)
shooterRsi (float)
shooterRsiValid (bool)
rsiRocEnterThreshold (float)
shooterRsiRoc (float)
fiveMinuteRsi (float)
fiveMinuteRsiValid (bool)
requireValid5MinuteRsiForEntry (bool)
stallLevelOffset (float)
stallLevelExceeded (bool)
stallTargetOffset (float)
recoverStallLevelValid (bool)
curBarChangeValid (bool)
volumeRoc (float)
volumeRocThreshold (float)
enableVolumeRocForTrigger (bool)
tradeActive (bool)
entryPrice (float)
curCloseOffset (float)
curSymCashDelta (float)
djiCashDelta (float)
showDjiDelta (bool)
longIndicator (bool)
fontSize (string)
Relativestrength
Market Strength Buy Sell Indicator [TradeDots]A specialized tool designed to assist traders in evaluating market conditions through a multifaceted analysis of relative performance, beta-adjusted returns, momentum, and volume—allowing you to identify optimal points for long or short trades. By integrating multiple benchmarks (default S&P 500) and percentile-based thresholds, the script provides clear, actionable insights suitable for both day trading and higher-level timeframe assessments.
📝 HOW IT WORKS
1. Multi-Factor Composite Score
Relative Performance (RS Ratio): Compares your asset’s performance to a chosen benchmark (default: SPY). Values above 1.0 indicate outperformance, while below 1.0 suggest underperformance.
Beta-Adjusted Returns: Checks the ticker’s excess movement relative to expected market-related moves. This helps distinguish pure “alpha” from broad market effects.
Volume & Correlation: Volume spikes often confirm the momentum behind a move, while correlation measures how closely the asset tracks or diverges from its benchmark.
These components merge into a 0–100 composite score. Scores above 50 frequently imply bullish strength; drops below 50 often point to underperformance—potentially flagging short opportunities.
2. Intraday & Day Trading Focus
Monitoring Below 50: During the trading day, the script calculates live data against the benchmark, offering an intraday-sensitive composite score. A dip under 50 may indicate a short bias for that session, especially when accompanied by high volume or momentum shifts.
3. Higher Timeframe Monitoring
Daily Strategies: On daily or weekly charts, the script reveals overall relative strength or weakness compared to the S&P 500. This higher-level perspective helps form broader trading biases—crucial for swing or position trades spanning multiple days.
Long/Short Thresholds: Persistent readings above 50 on a daily chart typically reinforce a long bias, while consistent dips below 50 can sustain a short or cautious outlook.
4. Pair Trading Applications
Custom Benchmark Selection: By setting a specific ticker pair as your benchmark instead of the default S&P 500, you can identify spread trading opportunities between two correlated assets. This allows you to go long the outperforming asset while shorting the underperforming one when the spread reaches extreme levels.
4. Color-Coded Signals & Alerts
Visual Zones (25–75): Color-coded bands highlight strong outperformance (above 75) or pronounced underperformance (below 25).
Alerts on Strong Shifts: Automatic alerts can notify you of sudden entries or exits from bullish or bearish zones, so you can potentially act on new market information without delay.
⚙️ HOW TO USE
1. Select Your Timeframe: For scalping or day trading, lower intervals (e.g., 5-minute) offer immediate data resets at the session’s start. For multi-day insight, daily or weekly charts reveal broader performance trends.
2. Watch Key Levels Around 50: Intraday dips under 50 may be a cue to consider short trades, while bounces above 50 can confirm renewed strength.
3. Assess Benchmark Relationships: Compare your asset’s score and signals to the broader market. A stock falling below its pair’s relative strength line might lag overall market momentum.
4. Combine Tools & Validate: This script excels when integrated with other technical analysis methods (e.g., support/resistance, chart patterns) and fundamental factors for a holistic market view.
❗ LIMITATIONS
No Direction Guarantee: The indicator identifies relative strength but does not guarantee directional price moves.
Delayed Updates: Since calculations update after each bar close, sudden intrabar changes may not immediately reflect.
Market-Specific Behaviors: Some assets or unusual market conditions may deviate from typical benchmarks, weakening signal reliability.
Past ≠ Future: High or low relative strength in the past may not predict continued performance.
RISK DISCLAIMER
All forms of trading and investing involve risk, including the possible loss of principal. This indicator analyzes relative performance but cannot assure profits or eliminate losses. Past performance of any strategy does not guarantee future results. Always combine analysis with proper risk management and your broader trading plan. Consult a licensed financial advisor if you are unsure of your individual risk tolerance or investment objectives.

Sector Relative StrengthDescription
This script compares sector performance relative to the S&P 500. Sector price levels or charts alone can mislead, because they tend to move with the broader market. An increase in a sector’s price does not necessarily indicate strength, as it may simply be following the index.
For more a more reliable picture, the script calculates a ratio between each sector ETF and SPY. If the ratio has increased, the sector has outperformed the index. In case it has declined, the sector has underperformed. If the value is near zero, the sector has moved in line with the index. The sectors are presented in a table and sorted on relative performance.
Calculation Method
The performance is expressed as a percentage change in the ratio over a user-defined lookback period. The default lookback is set to 21 bars, which corresponds to one month on a daily chart. This value can be adopted in the settings to match preferred time period.
Z-Score
In addition to the percentage change, the script calculates a Z-score of the ratio, which measures how far the current value deviates from its recent mean. A high positive Z-score indicates that the ratio is significantly above its average, while a negative value indicates it is below. This normalization allows for comparison between sectors with different price levels or volatility profiles.
Table Columns
- Relative %: The sector's performance relative to SPY over the selected lookback period
- Z-Score: Standardized measure of current performance ratio is relative to its average
- Trend Arrow: Indicates the direction of relative performance up down or flat
Example Interpretation
For example, if XLK shows a 3.7% change, it has outperformed SPY over the selected period. Another sector might show a -2.1% change, which indicates underperformance. While both values shows relative strength or weakness, the Z-score is optional and can provide additional context based on how unusual that performance is compared to the sector's own recent behavior.
Use Case
This approach helps evaluate overall market conditions and supports a top-down method. By starting with sector performance, it becomes easier to identify where the market is showing leadership or weakness. This allows the stock selection process to be more deliberate and can help refine or customize screeners based on certain sectors.

Apex Edge – Super RSIThe Apex Edge – Super RSI is not your average RSI. This is an institutional-grade signal engine designed for serious traders who want confluence, control, and confidence — all wrapped into one visual powerhouse.
━━━━━━━━━━━━━━━━━━━━
KEY FEATURES
━━━━━━━━━━━━━━━━━━━━
✔ **RSI + Divergence Engine**
• Classic & Hidden Divergences (auto-detected)
• Labelled with shapes:
▲ Green Triangle – Buy Signal (strength-based size)
▼ Red Triangle – Sell Signal
◆ Green Diamond – Classic Bullish Divergence
◆ Red Diamond – Classic Bearish Divergence
● Green Circle – Hidden Bullish Divergence
● Red Circle – Hidden Bearish Divergence
Note - Users can edit symbol colours in settings for better clarity
✔ **Trap Detection System**
• Detects low-move, high-signal clusters (liquidity traps)
• Automatically suppresses signals for X bars after detection
• Trap zones shown with shaded background (optional)
✔ **Signal Scoring Logic**
• Each signal is scored 1–6 based on:
• RSI Threshold Break
• RSI Slope
• Divergence Detected
• Trap Avoidance
• Multi-Timeframe Confluence (optional)
• The plotted shape size reflects the strength of the entry signal
✔ **Multi-Timeframe Confluence (MTF)**
• Optional filter that uses HTF and VHTF RSI alignment
• Prevents countertrend signals
• MTF Bias shown on HUD panel
✔ **Always-On HUD Panel**
• Displays:
• Signal Type
• Signal Score
• Divergence Type
• RSI (LTF & HTF)
• Trap & Cooldown Status
• MTF Bias
• Volatility %
✔ **Alert Ready**
• Buy/Sell alerts
• Trap Detected alert
• Divergence alert with dynamic message
• Perfect for webhook integrations
━━━━━━━━━━━━━━━━━━━━
📘 HOW TO TRADE IT
━━━━━━━━━━━━━━━━━━━━
✅ **Buy Setup**
• Green triangle (▲) appears **below bar**
• RSI is oversold and rising
• HTF RSI agrees (optional)
• Signal score is 3+ for best confidence
• Avoid signals during cooldown zone
✅ **Sell Setup**
• Red triangle (▼) appears **above bar**
• RSI is overbought and falling
• HTF RSI agrees (optional)
• Signal score is 3+ for best confidence
✅ **Divergences**
• Use diamonds/circles to identify momentum shifts
• Strongest when aligned with score 4–6
❗**Trap Zones**
• When background is shaded, wait for cooldown
• Signals during traps are suppressed for safety
━━━━━━━━━━━━━━━━━━━━
📊 BEST USED WITH
━━━━━━━━━━━━━━━━━━━━
🔹 Apex Edge – Session Sweep Pro (to visualize liquidity levels)
🔹 Volume Profile or OBV (volume-based confirmation)
🔹 EMA Ribbon (for trend alignment)
🔹 Fair Value Gap indicator (smart money models)
━━━━━━━━━━━━━━━━━━━━
🧠 PRO TIPS
━━━━━━━━━━━━━━━━━━━━
• Use the HUD for decision confidence — if everything aligns, you’ve got an Apex-grade setup.
• Wait for candle close to confirm divergence-based entries.
• Score 5–6 = sniper entries. Score 1–2 = warning shots.
This indicator can be used alongside Apex Edge Session Sweep Pro for better visual clarity.
━━━━━━━━━━━━━━━━━━━━
© Apex Edge | All rights reserved.
3 days ago
Release Notes
Update - Added a toggle to show/hide HUD when using on smaller mobile devices so as not to clutter the screen.

EU vs GU Strength @smEURUSD vs GBPUSD Strength Tester
✅ What it does:
-Plots EURUSD change (blue line)
-Plot GBPUSD change (green line)
-Plots EURGBP change (orange line)
Background turns bluish if EUR is stronger, greenish if GBP is stronger!
So, just by watching the background color, you can immediately tell:
If you prefer EURUSD or GBPUSD for your long/short setup.

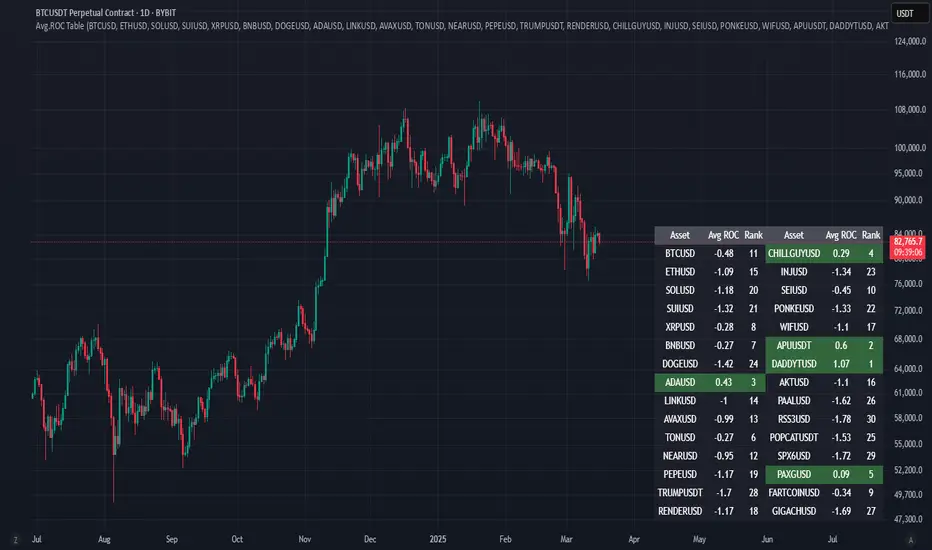
Avg.ROC TableThis indicator calculates the average Rate of Change (ROC) for up to 30 user-selected assets over a specified number of candles. It then ranks the assets—assigning rank 1 to the asset with the highest average ROC (strongest momentum) and rank 30 to the asset with the lowest. The results are displayed in a clean, easy-to-read table split into two stacks of 15 assets each, allowing you to quickly see which assets are performing best.
Adaptive RSI with Real-Time Divergence [AIBitcoinTrend]👽 Adaptive RSI Trailing Stop (AIBitcoinTrend)
The Adaptive RSI Trailing Stop is an indicator that integrates Gaussian-weighted RSI calculations with real-time divergence detection and a dynamic ATR-based trailing stop. This advanced approach allows traders to monitor momentum shifts, identify divergences early, and manage risk with adaptive trailing stop levels that adjust to price action.
👽 What Makes the Adaptive RSI with Signals and Trailing Stop Unique?
Unlike traditional RSI indicators, this version applies a Gaussian-weighted smoothing algorithm, making it more responsive to price action while reducing noise. Additionally, the trailing stop feature dynamically adjusts based on volatility and trend conditions, allowing traders to:
Detects real-time divergences (bullish/bearish) with a smart pivot-based system.
Filter noise with Gaussian weighting, ensuring smoother RSI transitions.
Utilize crossover-based trailing stop activation, for systematic trade management.
👽 The Math Behind the Indicator
👾 Gaussian Weighted RSI Calculation
Traditional RSI calculations rely on simple averages of gains and losses. Instead, this indicator weights recent price changes using a Gaussian distribution, prioritizing more relevant data points while maintaining smooth transitions.
Key Features:
Exponential decay ensures recent price changes are weighted more heavily.
Reduces short-term noise while maintaining responsiveness.
👾 Real-Time Divergence Detection
The indicator detects bullish and bearish divergences using pivot points on RSI compared to price action.
👾 Dynamic ATR-Based Trailing Stop
Bullish Trailing Stop: Activates when RSI crosses above 20 and dynamically adjusts based on low - ATR multiplier.
Bearish Trailing Stop: Activates when RSI crosses below 80 and adjusts based on high + ATR multiplier
This allows traders to:
Lock in profits systematically by adjusting stop-losses dynamically.
Stay in trades longer while maintaining adaptive risk management.
👽 How It Adapts to Market Movements
✔️ Gaussian Filtering ensures smooth RSI transitions while preventing excessive lag.
✔️ Real-Time Divergence Alerts provide early trade signals based on price-RSI discrepancies.
✔️ ATR Trailing Stop dynamically expands or contracts based on market volatility.
✔️ Crossover-Based Activation enables the stop-loss system only when RSI confirms a momentum shift.
👽 How Traders Can Use This Indicator
👾 Divergence Trading
Traders can use real-time divergence detection to anticipate reversals before they happen.
Bullish Divergence Setup:
Look for RSI making a higher low, while price makes a lower low.
Enter long when RSI confirms upward momentum.
Bearish Divergence Setup:
Look for RSI making a lower high, while price makes a higher high.
Enter short when RSI confirms downward momentum.
👾 Trailing Stop Signals
Bullish Signal and Trailing Stop Activation:
When RSI crosses above 20, a trailing stop is placed using low - ATR multiplier.
If price crosses below the stop, it exits the trade and removes the stop.
Bearish Signal and Trailing Stop Activation:
When RSI crosses below 80, a trailing stop is placed using high + ATR multiplier.
If price crosses above the stop, it exits the trade and removes the stop.
This makes trend-following strategies more efficient, while ensuring proper risk management.
👽 Why It’s Useful for Traders
✔️ Dynamic and Adaptive: Adjusts to changing market conditions automatically.
✔️ Noise Reduction: Gaussian-weighted RSI reduces short-term price distortions.
✔️ Comprehensive Strategy Tool: Combines momentum detection, divergence analysis, and automated risk management into a single indicator.
✔️ Works Across Markets & Timeframes: Suitable for stocks, forex, crypto, and futures trading.
👽 Indicator Settings
RSI Length: Defines the lookback period for RSI smoothing.
Gaussian Sigma: Controls how much weight is given to recent data points.
Enable Signal Line: Option to display an RSI-based moving average.
Divergence Lookback: Configures how far back pivot points are detected.
Crossover/crossunder values for signals: Set the crossover/crossunder values that triggers signals.
ATR Multiplier: Adjusts trailing stop sensitivity to market volatility.
Disclaimer: This indicator is designed for educational purposes and does not constitute financial advice. Please consult a qualified financial advisor before making investment decisions.

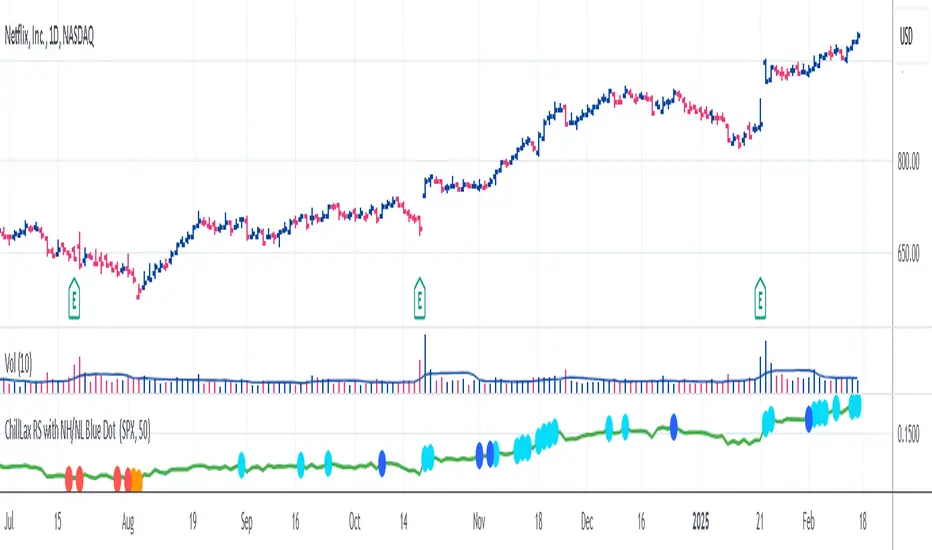
ChillLax Relative Strength Line with NewHigh NewLow Blue DotThis is similar to the IBD MarketSurge (MarketSmith) Blue Dot:
This plots the Relative Strength line vs. an index (default index is SPX), with a Dot when the RS line is hitting a New High.
If the RS hits a New High over the past X bars (default is 50), it shows a Light Blue (user definable) Dot on the RS line, if RS hits New High before the instrument hits New High, it shows a bigger/darker Blue Dot. Reverse for New Lows (orange for RS NL, Red for RS NL before Price NL)
This Dot is similar to the IBD Marketsurge RS New High Blue Dot, this indicator shows all the previous dots (MarketSurge shows only the last one). This on, unlike IBD, also shows RS New Lows. This one distinguishes RS NH before Price NH, and RS NL before Price NL. Lastly, IBD's lookback period is 52 week, here it is default to 50 days, but it is changeable.
Relative Performance SuiteOverview
The Relative Performance Suite (RPS) is a versatile and comprehensive indicator designed to evaluate an asset's performance relative to a benchmark. By offering multiple methods to measure performance, including Relative Performance, Alpha, and Price Ratio, this tool helps traders and investors assess asset strength, resilience, and overall behavior in different market conditions.
Key Features:
✅ Multiple Performance Measures:
Choose from various relative performance calculations, including:
Relative Performance:
Measures how much an asset has outperformed or underperformed its benchmark over a given period.
Relative Performance (Proportional):
A proportional version of relative performance,
factoring in scaling effects.
Relative Performance (MA Based):
Uses moving averages to smooth performance fluctuations.
Alpha:
A measure of an asset’s performance relative to what would be expected based on its beta and the benchmark’s return. It represents the excess return above the risk-free rate after adjusting for market risk.
Price Ratio:
Compares asset prices directly to determine relative value over time.
✅ Customizable Moving Averages:
Apply different moving average types (SMA, EMA, SMMA, WMA, VWMA) to smooth price inputs and refine calculations.
✅ Beta Calculation:
Includes a Beta measure used in Alpha calculation, which users can toggle the visibility of helping users understand an asset's sensitivity to market movements.
✅ Risk-Free Rate Adjustment:
Incorporate risk-free rates (e.g., US Treasury yields, Fed Funds Rate) for a more accurate calculation of Alpha.
✅ Logarithmic Returns Option:
Users can switch between standard returns and log returns for more refined performance analysis.
✅ Dynamic Color Coding:
Identify outperformance or underperformance with intuitive color coding.
Option to color bars based on relative strength, making chart analysis easier.
✅ Customizable Tables for Data Display:
Overview table summarizing key metrics.
Explanation table offering insights into how values are derived.
How to Use:
Select a Benchmark: Choose a comparison symbol (e.g., TOTAL or SPX ).
Pick a Performance Metric: Use different modes to analyze relative performance.
Customize Calculation Methods: Adjust moving averages, timeframes, and log returns based on preference.
Interpret the Colors & Tables: Utilize the dynamic coloring and tables to quickly assess market conditions.
Ideal For:
Traders looking to compare individual asset performance against an index or benchmark.
Investors analyzing Alpha & Beta to understand risk-adjusted returns.
Market analysts who want a visually intuitive and data-rich performance tracking tool.
This indicator provides a powerful and flexible way to track relative asset strength, helping users make more informed trading decisions.

Waldo Momentum Cloud Bollinger Bands (WMCBB)
Title: Waldo Momentum Cloud Bollinger Bands (WMCBB)
Description:
Introducing the "Waldo Momentum Cloud Bollinger Bands (WMCBB)," an innovative trading tool crafted for those who aim to deepen their market analysis by merging two dynamic technical indicators: Dynamic RSI Bollinger Bands and the Waldo Cloud.
What is this Indicator?
WMCBB integrates the volatility-based traditional Bollinger Bands with a momentum-sensitive approach through the Relative Strength Index (RSI). Here’s how it works:
Dynamic RSI Bollinger Bands: These bands dynamically adjust according to the RSI, which tracks the momentum of price movements. By scaling the RSI to align with price levels, we generate bands that not only reflect market volatility but also the underlying momentum, offering a refined view of overbought and oversold conditions.
Waldo Cloud: This feature adds a layer of traditional Bollinger Bands, visualized as a 'cloud' on your chart. It employs standard Bollinger Band methodology but enhances it with additional moving average layers to better define market trends.
The cloud's color changes dynamically based on various market conditions, providing visual signals for trend direction and potential trend reversals.
Why Combine These Indicators?
Combining Dynamic RSI Bollinger Bands with the Waldo Cloud in WMCBB aims to:
Enhance Trend Identification: The Waldo Cloud's color-coded system aids in recognizing the overarching market trend, while the Dynamic RSI Bands give insights into momentum changes within that trend, offering a comprehensive view.
Improve Volatility and Momentum Analysis: While traditional Bollinger Bands measure market volatility, integrating RSI adds a layer of momentum analysis, potentially leading to more accurate trading signals.
Visual Clarity: The unified color scheme for both sets of bands, which changes according to RSI levels, moving average crossovers, and price positioning, simplifies the process of gauging market sentiment at a glance.
Customization: Users have the option to toggle the visibility of moving averages (MA) through the settings, allowing for tailored analysis based on individual trading strategies.
Usage:
Utilize WMCBB to identify potential trend shifts by observing price interactions with the dynamic bands or changes in the Waldo Cloud's color.
Watch for divergences between price movements and RSI to forecast potential market reversals or continuations.
This combination shines in sideways markets where traditional indicators might fall short, as it provides additional context through RSI momentum analysis.
Settings:
Customize parameters for both the Dynamic RSI and Waldo Cloud Bollinger Bands, including the calculation source, standard deviation factors, and moving average lengths.
WMCBB is perfect for traders seeking to enhance their market analysis through the synergy of momentum and volatility, all while maintaining visual simplicity. Trade with greater insight using the Waldo Momentum Cloud Bollinger Bands!

Multi-Timeframe Confluence IndicatorThe Multi-Timeframe Confluence Indicator strategically combines multiple timeframes with technical tools like EMA and RSI to provide robust, high-probability trading signals. This combination is grounded in the principles of technical analysis and market behavior, tailored for traders across all styles—whether intraday, swing, or positional.
1. The Power of Multi-Timeframe Confluence
Markets are influenced by participants operating on different time horizons:
• Intraday traders act on short-term price fluctuations.
• Swing traders focus on intermediate trends lasting days or weeks.
• Position traders aim to capture multi-month or long-term trends.
By aligning signals from a higher timeframe (macro trend) with a lower timeframe (micro trend), the indicator ensures that short-term entries are in harmony with the broader market direction. This multi-timeframe approach significantly reduces false signals caused by temporary market noise or counter-trend moves.
Example: A bullish trend on the daily chart (higher timeframe) combined with a bullish RSI and EMA alignment on the 15-minute chart (lower timeframe) provides a stronger confirmation than relying on the 15-minute chart alone.
2. Why EMA and RSI Are Essential
Each element of the indicator serves a unique role in ensuring accuracy and reliability:
• EMA (Exponential Moving Average):
• A dynamic trend filter that adjusts quickly to price changes.
• On the higher timeframe, it establishes the overall trend direction (e.g., bullish or bearish).
• On the lower timeframe, it identifies precise entry/exit zones within the trend.
• RSI (Relative Strength Index):
• Adds a momentum-based perspective, confirming whether a trend is backed by strong buying or selling pressure.
• Ensures that signals occur in areas of strength (RSI > 55 for bullish signals, RSI < 45 for bearish signals), filtering out weak or uncertain price movements.
By combining EMA (trend) and RSI (momentum), the indicator delivers confluence-based validation, where both trend and momentum align, making signals more reliable.
3. Cooldown Period for Signal Optimization
Trading in choppy or sideways markets often leads to overtrading and false signals. The cooldown period ensures that once a signal is generated, subsequent signals are suppressed for a defined number of bars. This prevents traders from entering low-probability trades during indecisive market phases, improving overall signal quality.
Example: After a bullish confluence signal, the cooldown period prevents a bearish signal from being triggered prematurely if the market enters a temporary retracement.
4. Use Cases Across Trading Styles
This indicator caters to various trading styles, each benefiting from the confluence of timeframes and technical elements:
• Intraday Trading:
• Use a 1-hour chart as the higher timeframe and a 5-minute chart as the lower timeframe.
• Benefit: Align intraday entries with the hourly trend for higher win rates.
• Swing Trading:
• Use a daily chart as the higher timeframe and a 1-hour chart as the lower timeframe.
• Benefit: Capture multi-day moves while avoiding counter-trend entries.
• Scalping:
• Use a 30-minute chart as the higher timeframe and a 1-minute chart as the lower timeframe.
• Benefit: Enhance scalping efficiency by ensuring short-term trades align with broader intraday trends.
• Position Trading:
• Use a weekly chart as the higher timeframe and a daily chart as the lower timeframe.
• Benefit: Time long-term entries more precisely, maximizing profit potential.
5. Robustness Through Customization
The indicator allows traders to customize:
• Timeframes for higher and lower analysis.
• EMA lengths for trend filtering.
• RSI settings for momentum confirmation.
• Cooldown periods to adapt to market volatility.
This flexibility ensures that the indicator can be tailored to suit individual trading preferences, market conditions, and asset classes, making it a comprehensive tool for any trading strategy.
Why This Mashup Stands Out
The Multi-Timeframe Confluence Indicator is more than a sum of its parts. It leverages:
• EMA’s ability to identify trends, combined with RSI’s insight into momentum, ensuring each signal is well-supported.
• A multi-timeframe perspective that incorporates both macro and micro trends, filtering out noise and improving reliability.
• A cooldown mechanism that prevents overtrading, a common pitfall for traders in volatile markets.
This integration results in a powerful, adaptable indicator that provides actionable, high-confidence signals, reducing uncertainty and enhancing trading performance across all styles.

Sector Relative Strength [Afnan]This indicator calculates and displays the relative strength (RS) of multiple sectors against a chosen benchmark. It allows you to quickly compare the performance of various sectors within any global stock market. While the default settings are configured for the Indian stock market , this tool is not limited to it; you can use it for any market by selecting the appropriate benchmark and sector indices.
📊 Key Features ⚙️
Customizable Benchmark: Select any symbol as your benchmark for relative strength calculation. The default benchmark is set to `NSE:CNX100`. This allows for global market analysis by selecting the appropriate benchmark index of any country.
Multiple Sectors: Analyze up to 23 different sector indices. The default settings include major NSE sector indices. This can be customized to any market by using the relevant sector indices of that country.
Individual Sector Control: Toggle the visibility of each sector's RS on the chart.
Color-Coded Plots: Each sector's RS is plotted with a distinct color for easy identification.
Adjustable Lookback Period: Customize the lookback period for RS calculation.
Interactive Table: A sortable table displays the current RS values for all visible sectors, allowing for quick ranking.
Table Customization: Adjust the table's position, text size, and visibility.
Zero Line: A horizontal line at zero provides a reference point for RS values.
🧭 How to Use 🗺️
Add the indicator to your TradingView chart.
Select your desired benchmark symbol. The default is `NSE:CNX100`. For example, use SPY for the US market, or DAX for the German market.
Adjust the lookback period as needed.
Enable/disable the sector indices you want to analyze. The default includes major NSE sector indices like `NSE:CNXIT`, `NSE:CNXAUTO`, etc.
Customize the table's appearance as needed.
Observe the RS plots and the table to identify sectors with relative strength or weakness.
📝 Note 💡
This indicator is designed for sectorial analysis. You can use it with any market by selecting the appropriate benchmark and sector indices.
The default settings are configured for the Indian stock market with `NSE:CNX100` as the benchmark and major NSE sector indices pre-selected.
The relative strength calculation is based on the price change of the sector index compared to the benchmark over the lookback period.
Positive RS values indicate relative outperformance, while negative values indicate relative underperformance.
👨💻 Developer 🛠️
Afnan Tajuddin

Relative Price Strength (RPS)Relative Price Strength (RPS) is a technical analysis indicator that measures the performance of a specific symbol relative to a benchmark or "Base Symbol".
It's essentially a ratio that compares the price of the specific symbol to the price of the benchmark.
Rising RPS: Indicates that the symbol is outperforming the benchmark.
Falling RPS: Suggests that the symbol is underperforming the benchmark.
RSP is smoothed over a period for better visualization.

Adapted RSI w/ Multi-Asset Regime Detection v1.1The relative strength index (RSI) is a momentum indicator used in technical analysis. RSI measures the speed and magnitude of an asset's recent price changes to detect overbought or oversold conditions in the price of said asset.
In addition to identifying overbought and oversold assets, the RSI can also indicate whether your desired asset may be primed for a trend reversal or a corrective pullback in price. It can signal when to buy and sell.
The RSI will oscillate between 0 and 100. Traditionally, an RSI reading of 70 or above indicates an overbought condition. A reading of 30 or below indicates an oversold condition.
The RSI is one of the most popular technical indicators. I intend to offer a fresh spin.
Adapted RSI w/ Multi-Asset Regime Detection
Our Adapted RSI makes necessary improvements to the original Relative Strength Index (RSI) by combining multi-timeframe analysis with multi-asset monitoring and providing traders with an efficient way to analyse market-wide conditions across different timeframes and assets simultaneously. The indicator automatically detects market regimes and generates clear signals based on RSI levels, presenting this data in an organised, easy-to-read format through two dynamic tables. Simplicity is key, and having access to more RSI data at any given time, allows traders to prepare more effectively, especially when trading markets that "move" together.
How we calculate the RSI
First, the RSI identifies price changes between periods, calculating gains and losses from one look-back period to the next. This look-back period averages gains and losses over 14 periods, which in this case would be 14 days, and those gains/losses are calculated based on the daily closing price. For example:
Average Gain = Sum of Gains over the past 14 days / 14
Average Loss = Sum of Losses over the past 14 days / 14
Then we calculate the Relative Strength (RS):
RS = Average Gain / Average Loss
Finally, this is converted to the RSI value:
RSI = 100 - (100 / (1 + RS))
Key Features
Our multi-timeframe RSI indicator enhances traditional technical analysis by offering synchronised Daily, Weekly, and Monthly RSI readings with automatic regime detection. The multi-asset monitoring system allows tracking of up to 10 different assets simultaneously, with pre-configured major pairs that can be customised to any asset selection. The signal generation system provides clear market guidance through automatic regime detection and a five-level signal system, all presented through a sophisticated visual interface with dynamic RSI line colouring and customisable display options.
Quick Guide to Use it
Begin by adding the indicator to your chart and configuring your preferred assets in the "Asset Comparison" settings.
Position the two information tables according to your preference.
The main table displays RSI analysis across three timeframes for your current asset, while the asset table shows a comparative analysis of all monitored assets.
Signals are colour-coded for instant recognition, with green indicating bullish conditions and red for bearish conditions. Pay special attention to regime changes and signal transitions, using multi-timeframe confluence to identify stronger signals.
How it Works (Regime Detection & Signals)
When we say 'Regime', a regime is determined by a persistent trend or in this case momentum and by leveraging this for RSI, which is a momentum oscillator, our indicator employs a relatively simple regime detection system that classifies market conditions as either Bullish (RSI > 50) or Bearish (RSI < 50). Our benchmark between a trending bullish or bearish market is equal to 50. By leveraging a simple classification system helps determine the probability of trend continuation and the weight given to various signals. Whilst we could determine a Neutral regime for consolidating markets, we have employed a 'neutral' signal generation which will be further discussed below...
Signal generation occurs across five distinct levels:
Strong Buy (RSI < 15)
Buy (RSI < 30)
Neutral (RSI 30-70)
Sell (RSI > 70)
Strong Sell (RSI > 85)
Each level represents different market conditions and probability scenarios. For instance, extreme readings (Strong Buy/Sell) indicate the highest probability of mean reversion, while neutral readings suggest equilibrium conditions where traders should focus on the overall regime bias (Bullish/Bearish momentum).
This approach offers traders a new and fresh spin on a popular and well-known tool in technical analysis, allowing traders to make better and more informed decisions from the well presented information across multiple assets and timeframes. Experienced and beginner traders alike, I hope you enjoy this adaptation.

RS Cycles [QuantVue]The RS Cycles indicator is a technical analysis tool that expands upon traditional relative strength (RS) by incorporating Beta-based adjustments to provide deeper insights into a stock's performance relative to a benchmark index. It identifies and visualizes positive and negative performance cycles, helping traders analyze trends and make informed decisions.
Key Concepts:
Traditional Relative Strength (RS):
Definition: A popular method to compare the performance of a stock against a benchmark index (e.g., S&P 500).
Calculation: The traditional RS line is derived as the ratio of the stock's closing price to the benchmark's closing price.
RS=Stock Price/Benchmark Price
Usage: This straightforward comparison helps traders spot periods of outperformance or underperformance relative to the market or a specific sector.
Beta-Adjusted Relative Strength (Beta RS):
Concept: Traditional RS assumes equal volatility between the stock and benchmark, but Beta RS accounts for the stock's sensitivity to market movements.
Calculation:
Beta measures the stock's return relative to the benchmark's return, adjusted by their respective volatilities.
Alpha is then computed to reflect the stock's performance above or below what Beta predicts:
Alpha=Stock Return−(Benchmark Return×β)
Significance: Beta RS highlights whether a stock outperforms the benchmark beyond what its Beta would suggest, providing a more nuanced view of relative strength.
RS Cycles:
The indicator identifies positive cycles when conditions suggest sustained outperformance:
Short-term EMA (3) > Mid-term EMA (10) > Long-term EMA (50).
The EMAs are rising, indicating positive momentum.
RS line shows upward movement over a 3-period window.
EMA(21) > 0 confirms a broader uptrend.
Negative cycles are marked when the opposite conditions are met:
Short-term EMA (3) < Mid-term EMA (10) < Long-term EMA (50).
The EMAs are falling, indicating negative momentum.
RS line shows downward movement over a 3-period window.
EMA(21) < 0 confirms a broader downtrend.
This indicator combines the simplicity of traditional RS with the analytical depth of Beta RS, making highlighting true relative strength and weakness cycles.

RSI Strategy With TP/SL - Lower TFThis Pine Script strategy integrates the Relative Strength Index (RSI) for trade signals with user-defined Take Profit (TP) and Stop Loss (SL) levels. It's designed for flexible application in different market conditions, offering long, short, or dual-direction trading.
Short Description
The strategy uses the RSI to identify overbought and oversold market conditions:
Buy signal: When RSI drops below the specified "Buy Level."
Sell signal: When RSI rises above the "Sell Level."
Additionally, it manages risk and profit targets with:
Take Profit (TP): Exits trades when the price reaches a percentage gain.
Stop Loss (SL): Exits trades to limit losses if the price falls by a certain percentage.
The strategy is versatile and includes options for visualizing performance, monthly profit/loss data, and detailed trade metrics.
How to Use
Set Parameters:
RSI Period: Default is 14. Adjust based on your analysis.
RSI Buy/Sell Levels:
Buy Level: Default is 40. Consider higher levels for conservative entries.
Sell Level: Default is 60. Lower this for earlier exits.
Take Profit (%): Set your profit target (default: 5%).
Stop Loss (%): Set your risk tolerance (default: 2%).
Trade Direction: Choose "Long Only," "Short Only," or "Both."
Interpret Signals:
Buy signals appear when RSI crosses below the buy threshold.
Sell signals appear when RSI crosses above the sell threshold.
Risk Management:
The strategy dynamically calculates TP and SL levels for each trade.
TP/SL is applied using the percentage input based on the entry price.
Monitor Performance:
Review trade statistics in the "Strategy Tester."
Use the monthly performance table to track P/L across months.
Customize Alerts:
Alerts for buy, sell, TP, and SL events can be used to automate notifications.
Key Features
Configurable RSI Settings: Adaptable to various market conditions.
Risk Management: Built-in TP and SL management.
Customizable Trade Direction: Tailored for long-only, short-only, or both directions.
Monthly P/L Table: Visualizes performance trends over time.
Alerts: Notifies when critical trade events occur.
Please do your own research before ase this to your real trading.

Weighted Average Strength Index (WASI)Weighted Average Strength Index (WASI)
The Weighted Average Strength Index (WASI) is a variation of the standard RSI. It uses the Weighted Moving Average (WMA) instead of the Running Moving Average (RMA), making it more responsive to recent price changes. The hypothesis is that this weighted calculation might better capture momentum shifts, providing traders with more timely insights.
How to Use:
Backtest WASI on your preferred assets and timeframes to evaluate its effectiveness for your strategy.
Use for trend following or mean reversion :
- Overbought/Oversold (OB/OS) levels can signal potential mean-reversion opportunities.
- Midline (50 level) crossovers can be used for trend-following strategies.
- WASI and its moving average (MA) crossovers offer additional trend-following or reversal signals.
Parameters and Their Functions:
WASI Length: Determines the number of periods for WASI calculation. A longer length smooths the indicator but increases lag, while a shorter length makes it more sensitive. (When in doubt, go longer).
Source: The price source for the calculation (e.g., close, open, high, or low).
MA Type: Specifies the type of moving average applied to the WASI (options include SMA, EMA, WMA, HMA, and others).
MA Length: The number of periods for the moving average used on the WASI. Higher will lead to a smoother moving average.
Indicator Features:
Dynamic OB/OS Levels: Default overbought (70) and oversold (30) levels help identify potential reversal zones.
Midline Crossover: WASI crossing above or below the 50 level may indicate a trend shift.
WASI-MA Crossover: Crossovers between WASI and its moving average can signal trend-following or mean-reversion opportunities.
Disclaimer:
This indicator is a tool for analysis and should be used in conjunction with other forms of analysis or confirmation. Past performance does not guarantee future results.

Weekly RSI Buy/Sell SignalsWeekly RSI Buy/Sell Signal Indicator
This indicator is designed to help traders identify high-probability buy and sell opportunities on the weekly chart by using the Relative Strength Index (RSI). By utilizing weekly RSI values, this indicator ensures signals align with broader market trends, providing a clearer view of potential price reversals and continuation.
How It Works:
Weekly RSI Calculation: This script calculates the RSI using a 14-period setting, focusing on the weekly timeframe regardless of the user’s current chart view. The weekly RSI is derived using request.security, allowing for consistent signals even on intraday charts.
Signal Conditions:
Buy Signal: A buy signal appears when the RSI crosses above the oversold threshold of 30, suggesting that price may be gaining momentum after a potential bottom.
Sell Signal: A sell signal triggers when the RSI crosses below the overbought threshold of 70, indicating a possible momentum shift downwards.
Visual Cues:
Buy/Sell Markers: Clear green "BUY" and red "SELL" markers are displayed on the chart when buy or sell conditions are met, making it easy to identify entry and exit points.
RSI Line and Thresholds: The weekly RSI value is plotted in real time with color-coded horizontal lines at 30 (oversold) and 70 (overbought), providing a visual reference for key levels.
This indicator is ideal for traders looking for reliable, trend-based signals on higher timeframes and can be a helpful tool for filtering out shorter-term market noise.

Industry Group Strength - IndiaPresenting the Industry Group Strength Indicator for India market, designed to help traders identify top-performing stocks within specific industry groups that are predefined.
⦿ Identifies Leading Stocks in Industry Groups
⦿ Analyses the following metrics
YTD Return : Measures stock performance from the start of the year.
RS Rating : Relative Strength rating for user-selected periods.
% Return : Percentage return over a user-selected lookback period.
Features
This indicator dynamically recognises the industry group of the current stock on the chart and ranks stocks within that group based on predefined data points. Traders can add this indicator to focus on top-performing stocks relative to their industry.
⦿ Color-coded for Easy Visualisation
You can choose from the following key metrics to rank stocks:
YTD Return
RS Rating
% Return
⦿ Table Format with Performance Metrics Compact mode
Vertical View
Horizontal View
All of the three metrics are shown in the compact mode and the current stock that is viewed is highlighted!
Vertical view
Horizontal view
Stock Ranking
Stocks are ranked based on their performance within industry groups, enabling traders to easily spot leaders and laggards in each sector. Color-coded gradients visually represent the stocks’ performance rankings, with higher percentile rankings indicating better performance.
Relative Strength (RS)
Relative Strength (RS) compares a stock’s performance against the benchmark index. The RS value is normalized from 1 to 99, making it easier to compare across different stocks. A rising RS value indicates that the stock is outperforming the market, helping traders quickly gauge relative performance within industry groups.
Limitations
At the time of developing this indicator, Pine requests are limited to 40 per script so the predefined symbols had to be filtered to 40 per Industry group
Stocks Filters
Filters that are used to filter the stocks in an Industry group to have maximum of 40 stocks
⦿ Auto, Chemical, Engineering, Finance, Pharma
Market Cap >= 1000 Crores and Market Cap <= 60000 Crores
Price >= 30 and Price <= 6000
50 Days Average ( Price * Volume ) >= 6 Crores
⦿ For rest of the Industry groups
Market Cap >= 1000 Crores and Market Cap <= 100000 Crores
Price >= 20 and Price <= 10000
50 Days Average ( Price * Volume ) >= 3 Crores
Credits
This indicator is forked from the Script for US market by @Amphibiantrading Thanks Brandon for the beginning of this indicator.
This indicator is built on TradingView’s new dynamic requests feature, thanks to @PineCoders for making this possible!

Dynamic Sentiment RSI [UAlgo]The Dynamic Sentiment RSI is a technical analysis tool that combines the classic RSI (Relative Strength Index) concept with dynamic sentiment analysis, offering traders enhanced insights into market conditions. Unlike the traditional RSI, this indicator integrates volume weighting, sentiment factors, and smoothing features to provide a more nuanced view of momentum and potential market reversals. It is designed to assist traders in detecting overbought/oversold conditions, momentum shifts, and to generate potential buy or sell signals using crossover and crossunder techniques. By dynamically adjusting based on sentiment and volume factors, this RSI offers better adaptability to varying market conditions, making it suitable for different trading styles and timeframes.
This tool is particularly helpful for traders who wish to explore not only price movement but also the underlying market sentiment, offering a more comprehensive approach to momentum analysis. The sentiment factor amplifies the RSI's sensitivity to price shifts, making it easier to detect early signals of market reversals or the continuation of a trend.
🔶 Key Features
Dynamic Sentiment Calculation: The indicator incorporates a "Sentiment Factor" that adjusts the RSI length dynamically based on a multiplier, helping traders better understand market sentiment at different time intervals.
Volume Weighting: When enabled, the RSI calculations are weighted by volume, allowing traders to give more importance to price movements with higher trading volume, which may provide more accurate signals.
Smoothing Feature: A customizable smoothing period is applied to the RSI to help filter out noise and make the signal smoother. This feature is particularly useful for traders who prefer to focus on long-term trends while minimizing false signals.
Step Size Customization: A "Step Size" input allows users to round the sentiment RSI to predefined intervals, making the results easier to interpret and act upon. This feature allows you to focus on significant sentiment changes and ignore minor fluctuations.
Crossover/Crossunder Alerts: The indicator includes crossover and crossunder signals on the zero-line, helping traders identify potential buy and sell opportunities as the smoothed RSI crosses these levels.
The indicator offers a clear visual display with multiple color-coded lines and areas:
Sentiment RSI: Plotted as an area chart, color-coded based on sentiment strength.
Raw RSI: A purple line representing the raw adjusted RSI.
Smoothed RSI: A dynamic line, color-coded aqua or orange based on its position relative to the zero line.
Buy/Sell Signals: Triangle shapes are plotted at crossovers and crossunders, providing clear entry and exit points.
🔶 Interpreting the Indicator
Sentiment RSI
-This line represents the sentiment-adjusted RSI, where the higher the value, the stronger the bullish sentiment, and the lower the value, the stronger the bearish sentiment. It is rounded to step intervals, making it easier to detect significant shifts in sentiment.
- A positive sentiment RSI (above 0) suggests bullish market conditions, while a negative sentiment RSI (below 0) suggests bearish conditions.
Smoothed RSI
The smoothed RSI helps reduce noise and shows the trend more clearly.
Crossovers of the zero line are significant:
- Crossover above zero: Indicates that bullish momentum is building, potentially signaling a buying opportunity.
- Crossunder below zero: Signals a shift towards bearish momentum, potentially indicating a sell signal.
Traders should look for these crossovers in conjunction with other signals for more accurate entry/exit points.
Raw RSI (Adjusted)
The raw adjusted RSI offers a less smoothed, more responsive version of the RSI. While it may be noisier, it provides early signals of market reversals and trends.
Crossover/Crossunder Signals
- When the smoothed RSI crosses above the zero line, a "Signal Up" triangle appears, indicating a potential buying opportunity.
- When the smoothed RSI crosses below the zero line, a "Signal Down" triangle appears, signaling a potential sell opportunity.
These signals help traders time their entries and exits by identifying momentum shifts.
Volume Weighting (Optional)
- If volume weighting is enabled, the RSI will give more weight to periods of higher trading volume, making the signals more reliable when the market is highly active.
Strong Up/Down Levels (40/-40)
- These dotted lines represent extreme sentiment levels. When the sentiment RSI reaches 40 or -40, the market may be nearing an overbought or oversold condition, respectively. This could be a signal for traders to prepare for potential reversals or shifts in momentum.
By combining the various components of this indicator, traders can gain a comprehensive view of market sentiment and price action, helping them make more informed trading decisions. The combination of sentiment factors, volume weighting, and smoothing makes this indicator highly flexible and suitable for a variety of trading strategies.
🔶 Disclaimer
Use with Caution: This indicator is provided for educational and informational purposes only and should not be considered as financial advice. Users should exercise caution and perform their own analysis before making trading decisions based on the indicator's signals.
Not Financial Advice: The information provided by this indicator does not constitute financial advice, and the creator (UAlgo) shall not be held responsible for any trading losses incurred as a result of using this indicator.
Backtesting Recommended: Traders are encouraged to backtest the indicator thoroughly on historical data before using it in live trading to assess its performance and suitability for their trading strategies.
Risk Management: Trading involves inherent risks, and users should implement proper risk management strategies, including but not limited to stop-loss orders and position sizing, to mitigate potential losses.
No Guarantees: The accuracy and reliability of the indicator's signals cannot be guaranteed, as they are based on historical price data and past performance may not be indicative of future results.

Adaptive RSI-Stoch with Butterworth Filter [UAlgo]The Adaptive RSI-Stoch with Butterworth Filter is a technical indicator designed to combine the strengths of the Relative Strength Index (RSI), Stochastic Oscillator, and a Butterworth Filter to provide a smooth and adaptive momentum-based trading signal. This custom-built indicator leverages the RSI to measure market momentum, applies Stochastic calculations for overbought/oversold conditions, and incorporates a Butterworth Filter to reduce noise and smooth out price movements for enhanced signal reliability.
By utilizing these combined methods, this indicator aims to help traders identify potential market reversal points, momentum shifts, and overbought/oversold conditions with greater precision, while minimizing false signals in volatile markets.
🔶 Key Features
Adaptive RSI and Stochastic Oscillator: Calculates RSI using a configurable period and applies a dual-smoothing mechanism with Stochastic Oscillator values (K and D lines).
Helps in identifying momentum strength and potential trend reversals.
Butterworth Filter: An advanced signal processing filter that reduces noise and smooths out the indicator values for better trend identification.
The filter can be enabled or disabled based on user preferences.
Customizable Parameters: Flexibility to adjust the length of RSI, the smoothing factors for Stochastic (K and D values), and the Butterworth Filter period.
🔶 Interpreting the Indicator
RSI & Stochastic Calculations:
The RSI is calculated based on the closing price over the user-defined period, and further smoothed to generate Stochastic Oscillator values.
The K and D values of the Stochastic Oscillator provide insights into short-term overbought or oversold conditions.
Butterworth Filter Application:
What is Butterworth Filter and How It Works?
The Butterworth Filter is a type of signal processing filter that is designed to have a maximally flat frequency response in the passband, meaning it doesn’t distort the frequency components of the signal within the desired range. It is widely used in digital signal processing and technical analysis to smooth noisy data while preserving the important trends in the underlying data. In this indicator, the Butterworth Filter is applied to the trigger value, making the resulting signal smoother and more stable by filtering out short-term fluctuations or noise in price data.
Key Concepts Behind the Butterworth Filter:
Filter Design: The Butterworth filter works by calculating weighted averages of current and past inputs (price or indicator values) and outputs to produce a smooth output. It is characterized by the absence of ripple in the passband and a smooth roll-off after the cutoff frequency.
Cutoff Frequency: The period specified in the indicator acts as a control for the cutoff frequency. A higher period means the filter will remove more high-frequency noise and retain longer-term trends, while a lower period means it will respond more to short-term fluctuations in the data.
Smoothing Process: In this script, the Butterworth Filter is calculated recursively using the following formula,
butterworth_filter(series float input, int period) =>
float wc = math.tan(math.pi / period)
float k1 = 1.414 * wc
float k2 = wc * wc
float a0 = k2 / (1 + k1 + k2)
float a1 = 2 * a0
float a2 = a0
float b1 = 2 * (k2 - 1) / (1 + k1 + k2)
float b2 = (1 - k1 + k2) / (1 + k1 + k2)
wc: This is the angular frequency, derived from the period input.
k1 and k2: These are intermediate coefficients used in the filter calculation.
a0, a1, a2: These are the feedforward coefficients, which determine how much of the current and past input values will contribute to the filtered output.
b1, b2: These are feedback coefficients, which determine how much of the past output values will contribute to the current output, effectively allowing the filter to "remember" past behavior and smooth the signal.
Recursive Calculation: The filter operates by taking into account not only the current input value but also the previous two input values and the previous two output values. This recursive nature helps it smooth the signal by blending the recent past data with the current data.
float filtered_value = a0 * input + a1 * prev_input1 + a2 * prev_input2
filtered_value -= b1 * prev_output1 + b2 * prev_output2
input: The current input value, which could be the trigger value in this case.
prev_input1, prev_input2: The previous two input values.
prev_output1, prev_output2: The previous two output values.
This means the current filtered value is determined by the combination of:
A weighted sum of the current input and the last two inputs.
A correction based on the last two output values to ensure smoothness and remove noise.
In conclusion when filter is enabled, the Butterworth Filter smooths the RSI and Stochastic values to reduce market noise and highlight significant momentum shifts.
The filtered trigger value (post-Butterworth) provides a cleaner representation of the market's momentum.
Cross Signals for Trade Entries:
Buy Signal: A bullish crossover of the K value above the D value, particularly when the values are below 40 and when the Stochastic trigger is below 1 and the filtered trigger is below 35.
Sell Signal: A bearish crossunder of the K value below the D value, particularly when the values are above 60 and when the Stochastic trigger is above 99 and the filtered trigger is above 90.
These signals are plotted visually on the chart for easy identification of potential trading opportunities.
Overbought and Oversold Zones:
The indicator highlights the overbought zone when the filtered trigger surpasses a specific threshold (typically above 100) and the oversold zone when it drops below 0.
The color-coded fill areas between the Stochastic and trigger lines help visualize when the market may be overbought (likely a reversal down) or oversold (potential reversal up).
🔶 Disclaimer
Use with Caution: This indicator is provided for educational and informational purposes only and should not be considered as financial advice. Users should exercise caution and perform their own analysis before making trading decisions based on the indicator's signals.
Not Financial Advice: The information provided by this indicator does not constitute financial advice, and the creator (UAlgo) shall not be held responsible for any trading losses incurred as a result of using this indicator.
Backtesting Recommended: Traders are encouraged to backtest the indicator thoroughly on historical data before using it in live trading to assess its performance and suitability for their trading strategies.
Risk Management: Trading involves inherent risks, and users should implement proper risk management strategies, including but not limited to stop-loss orders and position sizing, to mitigate potential losses.
No Guarantees: The accuracy and reliability of the indicator's signals cannot be guaranteed, as they are based on historical price data and past performance may not be indicative of future results.

Relative Strength and MomentumRelative Strength and Momentum Indicator
Unlock deeper market insights with the Relative Strength and Momentum Indicator—a powerful tool designed to help traders and investors identify the strongest stocks and sectors based on relative performance. This custom indicator displays essential information on relative strength and momentum for up to 15 different symbols, compared against a benchmark index, all within a clear and organized table format.
Key Features:
1. Customizable Inputs: Choose up to 15 symbols to compare, along with a benchmark index, allowing you to tailor the indicator to your trading strategy. The 'Lookback Period' input defines how many weeks of data are analyzed for relative strength and momentum.
2. Relative Strength Calculation: For each selected symbol, the indicator calculates the Relative Strength (RS) against the chosen benchmark. This RS is further refined using an exponential moving average (EMA) to smooth the results, providing a more stable trend overview.
3. Momentum Analysis: Momentum is determined by analyzing the rate of change in relative strength. The indicator calculates a momentum rank for each symbol, based on its relative strength’s improvement or deterioration.
4. Percentile Ranking System: Each symbol is assigned a percentile rank (from 1 to 100) based on its relative strength compared to the others. Similarly, momentum rankings are also assigned from 1 to 100, offering a clear understanding of which assets are outperforming or underperforming.
5. Visual Indicators:
a. Green: Signals improving or stable relative strength and momentum.
b. Red: Indicates declining relative strength or momentum.
c. Aqua: Highlights symbols performing well on both relative strength and momentum—ideal candidates for further analysis.
6. Two Clear Tables:
a. Relative Strength Rank Table: Displays weekly rankings of relative strength for each symbol.
b. Momentum Table: Shows momentum trends, helping you identify which symbols are gaining or losing strength.
7. Color-Coded for Easy Analysis: The tables are color-coded to make analysis quick and straightforward. A green color means the symbol is performing well in terms of relative strength or momentum, while red indicates weaker performance. Aqua marks symbols that are excelling in both areas.
Use Case:
a. Sector Comparison: Identify which sectors or indexes are showing both relative strength and momentum to pick high-potential stocks. This allows you to align with broader market trends for improved trade entries.
b. Stock Selection: Quickly compare symbols within the same sector to find the stronger performers.

Saral Relative StrengthRelative Strength Indicator
### Overview
The Relative Strength (RS) Indicator is a robust tool designed to measure the performance of a security relative to a benchmark or another security. Unlike traditional indicators, this RS Indicator calculates the outperformance or underperformance in percentage terms, providing a clear and concise comparison.
The equation for calculation can be found in the code itself. This equation compares how much a security's price has changed over a given period (len) relative to the change in price of a benchmark over the same period. The result is expressed as a percentage, showing whether the security has outperformed or underperformed the benchmark. A positive RS value indicates outperformance, while a negative value signals underperformance.
Basically, this indicator is an enhanced version of 'Relative Strength' indicator of 'BharatTrader' Sir with added features like automatic divergence plotting, color-coded filled area and sector names for NSE F&O securities. Default values for some of the parameters are based on discussion by Subhadip Nandy Sir in Trader's Talk with Mr. Rohit Katwal.
### Input Parameters:
Source: The price of a security used in the calculation, with the default being the 'close' price.
Comparative Symbol: Ticker ID of the comparative security, with the default set to NIFTY 50.
Period-RS: The period for calculating the RS line, with a default of 22. The RS line measures the relative performance of the security against the benchmark, helping to identify outperformance or underperformance over time.
Period-MA: The period for calculating the Simple Moving Average (SMA) overlay on the RS line, with a default of 11. The SMA provides a smoothed view of the RS line, helping to identify trends more clearly.
Lookback - Zero Line Trend: Zero Line Trend look-back period, used to determine the angle of the RS line, with a default of 5. This parameter influences the color of the Zero Line based on whether the RS line’s angle is positive or negative.
Lookback - Divergence: Divergence look-back period, with a default of 2, used to detect divergence between the price and the RS line.
Display MA Line: Controls the display of the SMA line. When enabled, the SMA line is plotted over the RS line to indicate trend strength.
Toggle RS Color on MA Crossovers: Controls the color of the RS line. If disabled, the RS line is purple. If enabled, the RS line changes color based on its position relative to the SMA: green for RS > MA, red for RS < MA.
Display Zero Line Trend: Controls the display of the Zero Line. If disabled, the Zero Line is black. If enabled, the Zero Line’s color changes to green or maroon based on the RS line’s angle over time.
Display Divergence: Controls the display of divergence dots on the RS line, indicating potential reversal points.
Display Filled Area: Controls whether the area between the Zero Line and the RS line is filled with color. The fill color changes based on the relationship of the RS line with the SMA & Zero Line as given below.
- Dark Green: RS > 0 and RS > MA, indicating strong outperformance.
- Light Green: RS > 0 and RS < MA, indicating weakening outperformance.
- Dark Red: RS < 0 and RS < MA, indicating strong underperformance.
- Light Red: RS < 0 and RS > MA, indicating weakening underperformance.
Display Sector Name: Controls the display of sector names for NSE F&O securities, helping to plot RS with sectoral indices.
### Key Features:
RS Line:
The RS line represents the relative performance of a security against a benchmark over a specified period (default 22). It helps traders identify whether the security is outperforming or underperforming the benchmark.
SMA Overlay:
A Simple Moving Average (SMA) line is plotted over the RS line, with a default period of 11. The SMA provides a smoothed trend of the RS, making it easier to identify consistent performance trends.
Trend-Sensitive Zero Line:
The Zero Line’s color adapts based on the RS line’s trend:
- Green: Positive angle of the RS line, indicating upward momentum.
- Maroon: Negative angle, indicating downward momentum.
The color can be toggled, with an option to display the Zero Line in black.
Divergence Detection:
Automatically detects and highlights divergences.
- Positive Divergence: RS line rises while the price falls, marked by blue dots.
- Negative Divergence: RS line falls while the price rises, marked by black dots.
Color-Coded Fill Area:
The area between the RS line and the Zero Line is filled with color to visually distinguish different market conditions, with Dark and Light colors providing insight into the strength of the performance:
- Dark Green: Indicates strong outperformance (RS > 0 and RS > MA), suggesting the security is showing significant strength compared to the benchmark.
- Light Green: Indicates weakening outperformance (RS > 0 and RS < MA), signaling that while the security is still outperforming, its strength is diminishing.
- Dark Red: Indicates strong underperformance (RS < 0 and RS < MA), showing the security is significantly weaker than the benchmark.
- Light Red: Indicates weakening underperformance (RS < 0 and RS > MA), suggesting the security is still underperforming but may be regaining some strength.
Sectoral Strength:
Displays sector names for NSE F&O securities, helping users to compare the RS of individual securities with their respective sectoral indices. Comparative Security can be changed easily based on this sector name. Users need not to remember sector names for individual securities.
If any security is not categorized in a specific sector, CNX500 has been considered as a default sector for NSE F&O securities. For other securities, NIFTY50 has been considered as a default sector.
