OPEN-SOURCE SCRIPT
RSI+Bollinger Bands
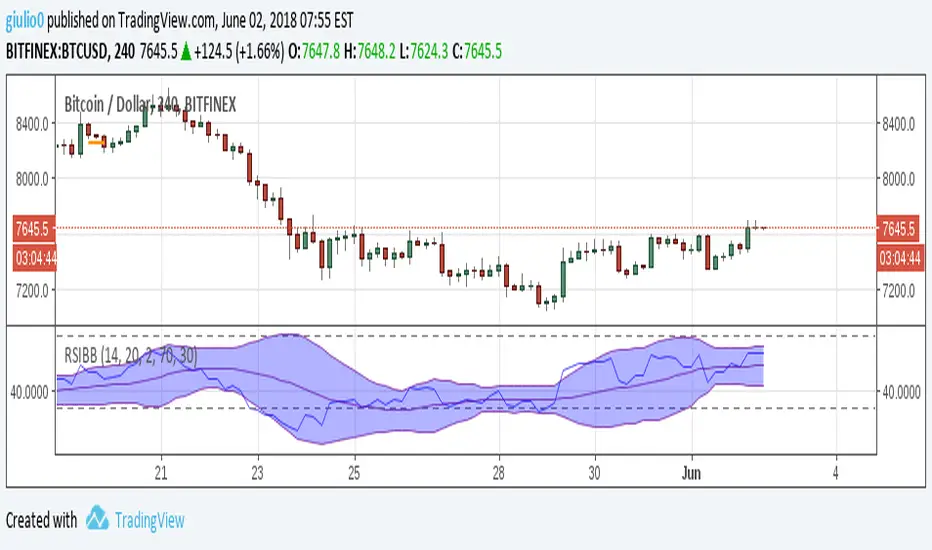
This is a simple RSI with applied Bollinger Bands. The BB may help spotting "hidden" divergences or "fake" divergences. For instance: in an uptrend we have a high followed by a higher high, the plain RSI shows a divergence, adding BB we see that the first (higher) RSI high is inside the BB, while the second (lower) RSI high is outside the bands, this would be a fake divergence.
The use of the indicator should be straightforward, for any questions feel free to write me a message
The use of the indicator should be straightforward, for any questions feel free to write me a message
開源腳本
秉持TradingView一貫精神,這個腳本的創作者將其設為開源,以便交易者檢視並驗證其功能。向作者致敬!您可以免費使用此腳本,但請注意,重新發佈代碼需遵守我們的社群規範。
免責聲明
這些資訊和出版物並非旨在提供,也不構成TradingView提供或認可的任何形式的財務、投資、交易或其他類型的建議或推薦。請閱讀使用條款以了解更多資訊。
免責聲明
這些資訊和出版物並非旨在提供,也不構成TradingView提供或認可的任何形式的財務、投資、交易或其他類型的建議或推薦。請閱讀使用條款以了解更多資訊。