OPEN-SOURCE SCRIPT
ZScore Plot with Ranked Table
Version 0.1
ZScore Plot with Ranked Table — Overview
This indicator visualizes the rolling ZScores of up to 10 crypto assets, giving traders a normalized view of log return deviations over time. It's designed for volatility analysis, anomaly detection, and clustering of asset behavior.
🎯 Purpose
• Show how each asset's performance deviates from its historical mean
• Identify potential overbought/oversold conditions across assets
• Provide a ranked leaderboard to compare asset behavior instantly
⚙️ Inputs
• Lookback: Number of bars to calculate mean and standard deviation
• Asset 1–10: Choose up to 10 symbols (e.g. BTCUSDT, ETHUSDT)
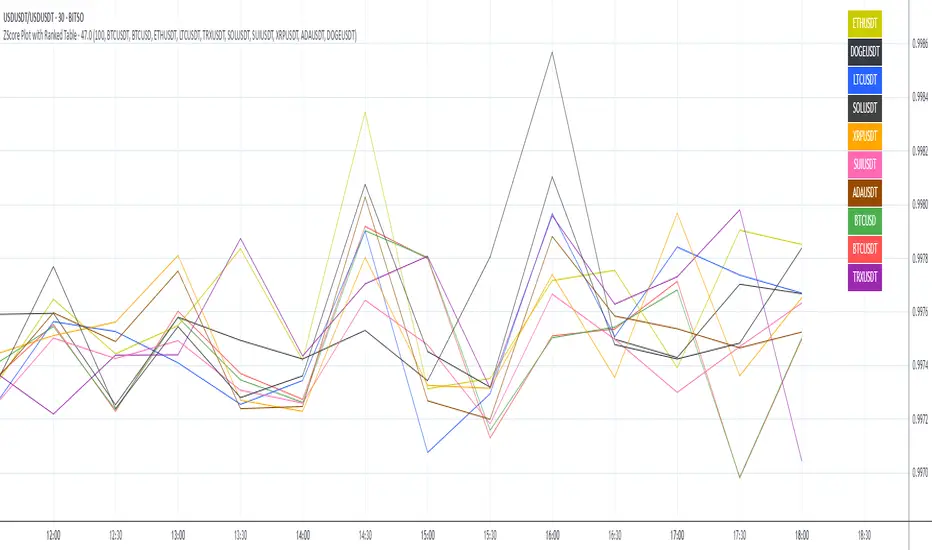
📈 Outputs
• ZScore Lines: Each asset plotted on a normalized scale (mean = 0, SD = 1)
• End-of-Line Labels: Asset names displayed at latest bar
• Leaderboard Table: Ranked list (top-right) showing:
◦ Asset name (color-matched)
◦ Final ZScore (rounded to 3 decimals)
🧠 Use Cases
• Quantitative traders seeking cross-asset momentum snapshots
• Signal engineers tracking volatility clusters
• Risk managers monitoring outliers and systemic shifts
ZScore Plot with Ranked Table — Overview
This indicator visualizes the rolling ZScores of up to 10 crypto assets, giving traders a normalized view of log return deviations over time. It's designed for volatility analysis, anomaly detection, and clustering of asset behavior.
🎯 Purpose
• Show how each asset's performance deviates from its historical mean
• Identify potential overbought/oversold conditions across assets
• Provide a ranked leaderboard to compare asset behavior instantly
⚙️ Inputs
• Lookback: Number of bars to calculate mean and standard deviation
• Asset 1–10: Choose up to 10 symbols (e.g. BTCUSDT, ETHUSDT)
📈 Outputs
• ZScore Lines: Each asset plotted on a normalized scale (mean = 0, SD = 1)
• End-of-Line Labels: Asset names displayed at latest bar
• Leaderboard Table: Ranked list (top-right) showing:
◦ Asset name (color-matched)
◦ Final ZScore (rounded to 3 decimals)
🧠 Use Cases
• Quantitative traders seeking cross-asset momentum snapshots
• Signal engineers tracking volatility clusters
• Risk managers monitoring outliers and systemic shifts
開源腳本
秉持TradingView一貫精神,這個腳本的創作者將其設為開源,以便交易者檢視並驗證其功能。向作者致敬!您可以免費使用此腳本,但請注意,重新發佈代碼需遵守我們的社群規範。
免責聲明
這些資訊和出版物並非旨在提供,也不構成TradingView提供或認可的任何形式的財務、投資、交易或其他類型的建議或推薦。請閱讀使用條款以了解更多資訊。
開源腳本
秉持TradingView一貫精神,這個腳本的創作者將其設為開源,以便交易者檢視並驗證其功能。向作者致敬!您可以免費使用此腳本,但請注意,重新發佈代碼需遵守我們的社群規範。
免責聲明
這些資訊和出版物並非旨在提供,也不構成TradingView提供或認可的任何形式的財務、投資、交易或其他類型的建議或推薦。請閱讀使用條款以了解更多資訊。