OPEN-SOURCE SCRIPT
MAD Ratio with Buy/Sell Signals
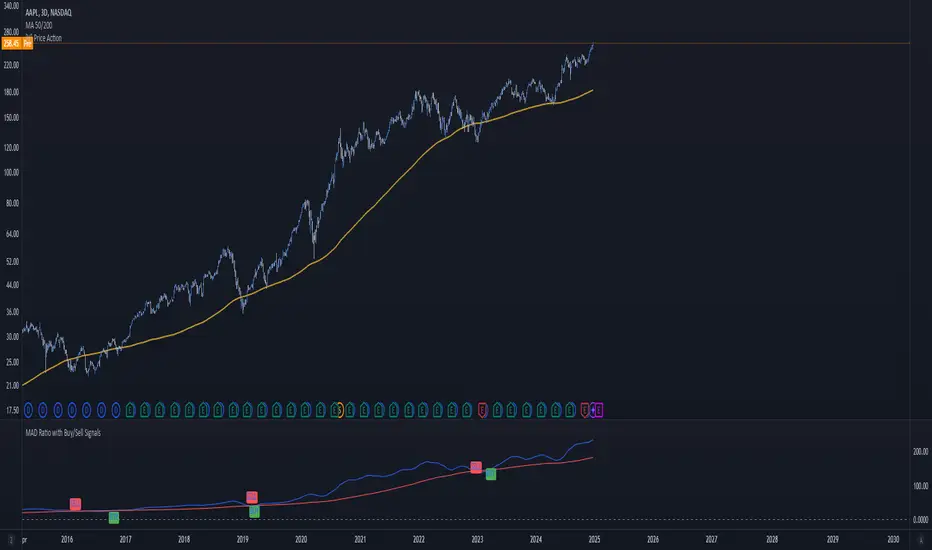
This code creates an indicator that generates Buy and Sell signals based on the Moving Average Distance (MAD) Ratio and the crossover/crossunder of two Simple Moving Averages (SMA). Here's a breakdown of what it does:
What the Indicator Shows:
Moving Averages:
21-day SMA (shortMA): Plotted in blue.
200-day SMA (longMA): Plotted in red.
These lines visually represent short-term and long-term trends in price.
Horizontal Reference Line:
A gray horizontal line at Ratio = 1 marks when the 21-day SMA and 200-day SMA are equal. This is the neutral point for the MAD ratio.
Buy and Sell Signals:
Buy Signal (Green Label):
Triggered when:
MAD Ratio > 1 (shortMA is greater than longMA, indicating upward momentum).
The 21-day SMA crosses above the 200-day SMA.
Displays a green "BUY" label below the price chart.
Sell Signal (Red Label):
Triggered when:
MAD Ratio < 1 (shortMA is less than longMA, indicating downward momentum).
The 21-day SMA crosses below the 200-day SMA.
Displays a red "SELL" label above the price chart.
開源腳本
秉持TradingView一貫精神,這個腳本的創作者將其設為開源,以便交易者檢視並驗證其功能。向作者致敬!您可以免費使用此腳本,但請注意,重新發佈代碼需遵守我們的社群規範。
免責聲明
這些資訊和出版物並非旨在提供,也不構成TradingView提供或認可的任何形式的財務、投資、交易或其他類型的建議或推薦。請閱讀使用條款以了解更多資訊。
免責聲明
這些資訊和出版物並非旨在提供,也不構成TradingView提供或認可的任何形式的財務、投資、交易或其他類型的建議或推薦。請閱讀使用條款以了解更多資訊。