OPEN-SOURCE SCRIPT
Midpoint of Last 3 Candles
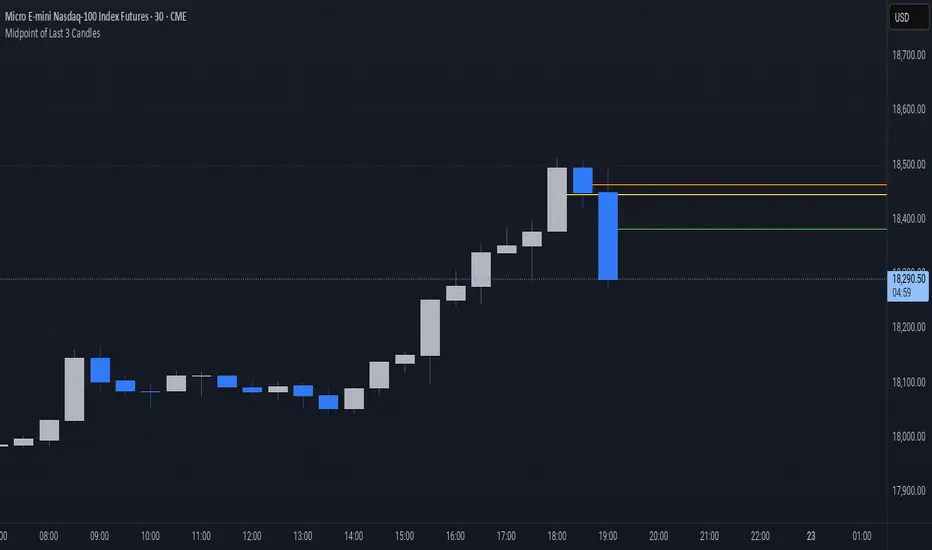
This indicator highlights the market structure by plotting the midpoints of the current and previous two candles. It draws a horizontal line at the average of the high and low for each of these candles, giving a visual cue of the short-term balance point in price action. These midpoints can act as dynamic support and resistance levels, helping traders assess areas of potential reaction or continuation.
Each line is color-coded for clarity: green represents the current candle, orange marks the previous candle, and yellow indicates the one before that. All lines extend into the future on the chart, allowing you to see how price interacts with these levels as new candles form. This simple yet effective tool can be useful in various strategies, especially those focused on price action, scalping, or intraday analysis.
Each line is color-coded for clarity: green represents the current candle, orange marks the previous candle, and yellow indicates the one before that. All lines extend into the future on the chart, allowing you to see how price interacts with these levels as new candles form. This simple yet effective tool can be useful in various strategies, especially those focused on price action, scalping, or intraday analysis.
開源腳本
秉持TradingView一貫精神,這個腳本的創作者將其設為開源,以便交易者檢視並驗證其功能。向作者致敬!您可以免費使用此腳本,但請注意,重新發佈代碼需遵守我們的社群規範。
免責聲明
這些資訊和出版物並非旨在提供,也不構成TradingView提供或認可的任何形式的財務、投資、交易或其他類型的建議或推薦。請閱讀使用條款以了解更多資訊。
免責聲明
這些資訊和出版物並非旨在提供,也不構成TradingView提供或認可的任何形式的財務、投資、交易或其他類型的建議或推薦。請閱讀使用條款以了解更多資訊。