OPEN-SOURCE SCRIPT
已更新 Daily ATR Zones
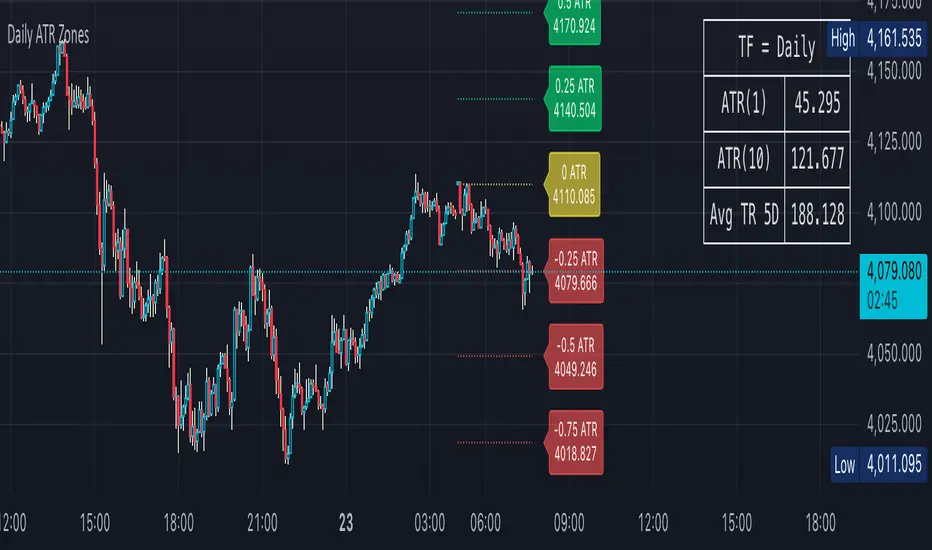
Dynamic Daily ATR Projection Zones
### **Description:**
This indicator projects potential price levels for the current trading day based on the Average True Range (ATR) of the previous day. It is designed to help intraday traders visualize daily volatility and identify key potential support, resistance, or target levels that are fixed for the entire session and do not repaint.
**How It Works**
The logic is based on two key components: a stable base price and a reliable volatility measure.
* **Base Price:** The indicator uses the **Open price of the current day** as the central anchor point for all projections.
* **Volatility Measure:** The calculation uses the final, completed **ATR value from the previous day**. This ensures that the projected zones are constant throughout the current trading day and are not subject to repainting.
The projection levels are then calculated using the formula:
`Current Day's Open + (Previous Day's ATR * Multiplier)`
**Features**
This script is fully customizable to fit your trading style:
* **Customizable ATR Multipliers:** Easily define your own price zones by entering a comma-separated list of multipliers (e.g., `0.5, 1.0, 1.5, -0.5, -1.0`).
* **Dynamic & Movable Labels:** The price labels are designed to stay on the right edge of the chart, ensuring they never obscure the current price action.
* **Adjustable Label Position:** Use the "Label Horizontal Offset" setting to control how far the labels are positioned from the current bar, keeping your chart clean.
* **Adjustable Label Size:** Choose from five different sizes (Tiny, Small, Normal, Large, Huge) to ensure the labels are perfectly readable on any device.
* **Toggle Labels:** You can turn all labels on or off with a single checkbox.
* **Full Color Customization:** Set unique colors for the positive (upper), negative (lower), and neutral projection zones.
**How to Use**
This tool can be integrated into various intraday trading strategies:
* **Intraday Targets:** The projected levels can serve as potential take-profit or stop-loss targets for scalpers and day traders.
* **Support & Resistance:** Watch for price reactions, such as bounces or rejections, at these ATR levels, as they often act as dynamic support and resistance zones.
* **Volatility Gauge:** The zones provide a quick visual reference for how far the price has moved relative to its recent average daily range. For example, if the price reaches the `1.0 ATR` level, it has completed an "average" day's move.
發行說明
This indicator projects potential price levels for the current trading day based on the Average True Range (ATR) of the previous day. It is designed to help intraday traders visualize daily volatility and identify key potential support, resistance, or target levels that are fixed for the entire session and do not repaint.
**How It Works**
The logic is based on two key components: a stable base price and a reliable volatility measure.
* **Base Price:** The indicator uses the **Open price of the current day** as the central anchor point for all projections.
* **Volatility Measure:** The calculation uses the final, completed **ATR value from the previous day**. This ensures that the projected zones are constant throughout the current trading day and are not subject to repainting.
The projection levels are then calculated using the formula:
`Current Day's Open + (Previous Day's ATR * Multiplier)`
**Features**
This script is fully customizable to fit your trading style:
* **Customizable ATR Multipliers:** Easily define your own price zones by entering a comma-separated list of multipliers (e.g., `0.5, 1.0, 1.5, -0.5, -1.0`).
* **Dynamic & Movable Labels:** The price labels are designed to stay on the right edge of the chart, ensuring they never obscure the current price action.
* **Adjustable Label Position:** Use the "Label Horizontal Offset" setting to control how far the labels are positioned from the current bar, keeping your chart clean.
* **Adjustable Label Size:** Choose from five different sizes (Tiny, Small, Normal, Large, Huge) to ensure the labels are perfectly readable on any device.
* **Toggle Labels:** You can turn all labels on or off with a single checkbox.
* **Full Color Customization:** Set unique colors for the positive (upper), negative (lower), and neutral projection zones.
**How to Use**
This tool can be integrated into various intraday trading strategies:
* **Intraday Targets:** The projected levels can serve as potential take-profit or stop-loss targets for scalpers and day traders.
* **Support & Resistance:** Watch for price reactions, such as bounces or rejections, at these ATR levels, as they often act as dynamic support and resistance zones.
* **Volatility Gauge:** The zones provide a quick visual reference for how far the price has moved relative to its recent average daily range. For example, if the price reaches the `1.0 ATR` level, it has completed an "average" day's move.
** Cosmetic update
發行說明
Description:Overview
This script calculates and plots price projection zones based on the daily Average True Range (ATR). The zones are calculated once at the beginning of the daily session and remain fixed, ensuring they do not repaint. The purpose is to provide a static map of volatility-based price levels relative to the day's open.
Calculation Method
The indicator's calculation is based on the following components:
Base Price: The opening price of the current daily session.
Volatility Input: The final, closed ATR value from the previous daily session.
Formula: The script uses the formula Current Day Open + (Previous Day ATR * Multiplier) to determine the price for each zone line.
Features and Settings
The indicator includes several settings for customization:
ATR Multipliers: A user-defined, comma-separated string to set the desired ATR levels (e.g., 0.5, 1.0, -0.5, -1.0).
Labels: Labels can be toggled on or off. They are designed to stay positioned on the right side of the chart to avoid obscuring price bars.
Label Horizontal Offset: An integer input to adjust the horizontal distance of the labels from the most recent bar.
Label Size: A dropdown menu to select the font size of the labels.
Colors: Customizable colors for the upper (positive) and lower (negative) zone lines.
* Rewrite Description + added historical lines and labels
發行說明
Add Table, MA selection and some cosmetics發行說明
Fixed typo開源腳本
秉持TradingView一貫精神,這個腳本的創作者將其設為開源,以便交易者檢視並驗證其功能。向作者致敬!您可以免費使用此腳本,但請注意,重新發佈代碼需遵守我們的社群規範。
免責聲明
這些資訊和出版物並非旨在提供,也不構成TradingView提供或認可的任何形式的財務、投資、交易或其他類型的建議或推薦。請閱讀使用條款以了解更多資訊。
開源腳本
秉持TradingView一貫精神,這個腳本的創作者將其設為開源,以便交易者檢視並驗證其功能。向作者致敬!您可以免費使用此腳本,但請注意,重新發佈代碼需遵守我們的社群規範。
免責聲明
這些資訊和出版物並非旨在提供,也不構成TradingView提供或認可的任何形式的財務、投資、交易或其他類型的建議或推薦。請閱讀使用條款以了解更多資訊。