OPEN-SOURCE SCRIPT
Multi-EMA System (9,34,50,200)
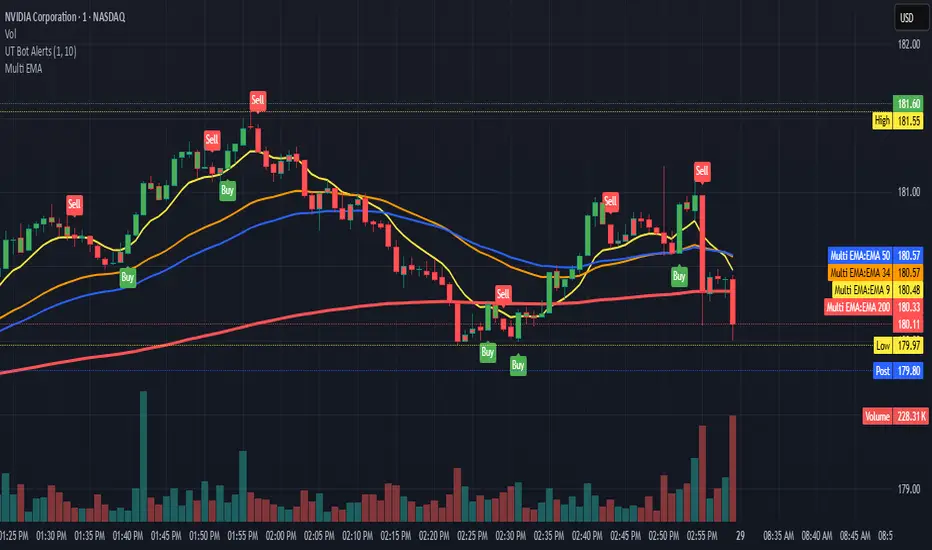
This script gives you:
Yellow line: 9 EMA (your fastest momentum indicator)
Orange line: 34 EMA (good for short-term trend confirmation)
Blue line: 50 EMA (classic medium-term trend line)
Red line: 200 EMA (the big daddy - long-term trend and major support/resistance)
I made the 200 EMA a bit thicker since it's usually the most significant level. You can adjust the colors in the script if you prefer different ones.
開源腳本
秉持TradingView一貫精神,這個腳本的創作者將其設為開源,以便交易者檢視並驗證其功能。向作者致敬!您可以免費使用此腳本,但請注意,重新發佈代碼需遵守我們的社群規範。
免責聲明
這些資訊和出版物並非旨在提供,也不構成TradingView提供或認可的任何形式的財務、投資、交易或其他類型的建議或推薦。請閱讀使用條款以了解更多資訊。
免責聲明
這些資訊和出版物並非旨在提供,也不構成TradingView提供或認可的任何形式的財務、投資、交易或其他類型的建議或推薦。請閱讀使用條款以了解更多資訊。