INVITE-ONLY SCRIPT
已更新 Open Interest by strike
Overview:
What is open interest (OI)? Is the total number of open derivative contracts, such as options, that have not been settled. These positions have been opened, but have not been closed out, expired, or exercised. This indicator helps with giving the open interest of selected equities on the market. It will give you the current weekly expiration date and has also the option to give the monthly expiration date (3rd Friday of the month).
How it works/Calculations:
This indicator will bring the data from an outside source and will have the closest options strikes to the current spot price of the underlying. The bars size will be equivalent to the amount of open interest. In the settings, you can see current weekly expiration options OI or have the option to see monthly expiration. When the weekly expiration is the monthly expiration week, then monthly expiration will show the next monthly expiration. (Example: On December 6, 2023 you will see weekly expiration of Dec 8, 2023 and monthly expiration will be Dec 15, 2023. On December 11, 2023 you will see weekly expiration of Dec 15, 2023 and monthly expiration will be Jan 19, 2024). You will also have the option to see the values or hide them. Also can see delta OI (for each strike subtract the calls and puts and display the remaining values). Open Interest updaters once a day, this indicator will update as well to give the most current values.
Current equities available for the data:
1. XLK 2. XLY 3. XLV 4. XLI 5. XLF 6. AAPL 7. MSFT 8. NVDA 9. AMD 10. V 11. Crm 12. Meta 13. Goog 14. NFLX 15. Amzn 16. Tsla 17. HD 18. Low 19. TGT 20. Wmt 21. XOM 22. Cvx 23. JPM 24. AXP 25. GS 26. ABBV 27. Cat 28. DE 29. BA 30. Fdx 31. UPS 32. Shop 33. SQ 34. Abnb 35. Snow 36. Coin 37. Crwd 38. Uber 39. SBUX 40. ENPH 41. XLP 42. XLE 43. XLB 44. NKE 45. UPS
How to use:
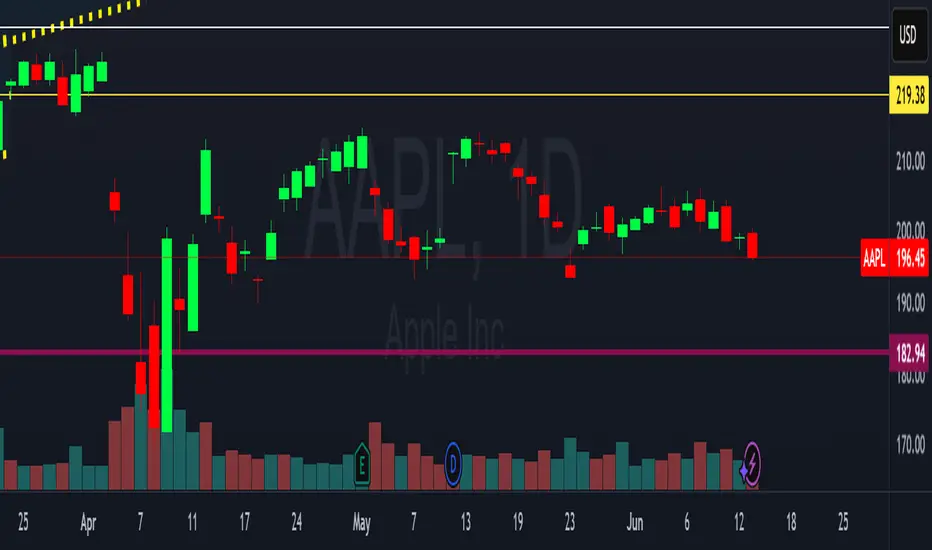
You should not be using this indicator for entries or stop. This indicator will help you see where there are possible levels that will serve as imaginary support and resistance.
Settings:
As above, you can choose weekly or monthly expiration date as explained above. Also you can choose to see the values or delta OI or no values.
Disclaimer:
This is still an indicator that in no way should be used alone.
The information contained in this script does not constitute financial advice or a solicitation to buy or sell any securities of any type. I will not accept liability for any loss or damage, including without limitation any loss of profit, which may arise directly or indirectly from the use of or reliance on such information.
All investments involve risk, and the past performance of a security, industry, sector, market, financial product, trading strategy, backtest, or individual's trading does not guarantee future results or returns. Investors are fully responsible for any investment decisions they make. Such decisions should be based solely on an evaluation of their financial circumstances, investment objectives, risk tolerance, and liquidity needs.
My Scripts are only for educational purposes!
What is open interest (OI)? Is the total number of open derivative contracts, such as options, that have not been settled. These positions have been opened, but have not been closed out, expired, or exercised. This indicator helps with giving the open interest of selected equities on the market. It will give you the current weekly expiration date and has also the option to give the monthly expiration date (3rd Friday of the month).
How it works/Calculations:
This indicator will bring the data from an outside source and will have the closest options strikes to the current spot price of the underlying. The bars size will be equivalent to the amount of open interest. In the settings, you can see current weekly expiration options OI or have the option to see monthly expiration. When the weekly expiration is the monthly expiration week, then monthly expiration will show the next monthly expiration. (Example: On December 6, 2023 you will see weekly expiration of Dec 8, 2023 and monthly expiration will be Dec 15, 2023. On December 11, 2023 you will see weekly expiration of Dec 15, 2023 and monthly expiration will be Jan 19, 2024). You will also have the option to see the values or hide them. Also can see delta OI (for each strike subtract the calls and puts and display the remaining values). Open Interest updaters once a day, this indicator will update as well to give the most current values.
Current equities available for the data:
1. XLK 2. XLY 3. XLV 4. XLI 5. XLF 6. AAPL 7. MSFT 8. NVDA 9. AMD 10. V 11. Crm 12. Meta 13. Goog 14. NFLX 15. Amzn 16. Tsla 17. HD 18. Low 19. TGT 20. Wmt 21. XOM 22. Cvx 23. JPM 24. AXP 25. GS 26. ABBV 27. Cat 28. DE 29. BA 30. Fdx 31. UPS 32. Shop 33. SQ 34. Abnb 35. Snow 36. Coin 37. Crwd 38. Uber 39. SBUX 40. ENPH 41. XLP 42. XLE 43. XLB 44. NKE 45. UPS
How to use:
You should not be using this indicator for entries or stop. This indicator will help you see where there are possible levels that will serve as imaginary support and resistance.
Settings:
As above, you can choose weekly or monthly expiration date as explained above. Also you can choose to see the values or delta OI or no values.
Disclaimer:
This is still an indicator that in no way should be used alone.
The information contained in this script does not constitute financial advice or a solicitation to buy or sell any securities of any type. I will not accept liability for any loss or damage, including without limitation any loss of profit, which may arise directly or indirectly from the use of or reliance on such information.
All investments involve risk, and the past performance of a security, industry, sector, market, financial product, trading strategy, backtest, or individual's trading does not guarantee future results or returns. Investors are fully responsible for any investment decisions they make. Such decisions should be based solely on an evaluation of their financial circumstances, investment objectives, risk tolerance, and liquidity needs.
My Scripts are only for educational purposes!
發行說明
This update fixes a bug on the bars showing at times the wrong numbers. 發行說明
Update code to fix monthly and weekly data. 發行說明
Unfortunately script not working as intended. PLEASE DO NOT TRY TO GET ACCESS. IF WE CAN GET IT TO WORK WILL FIX IT.
僅限邀請腳本
僅作者批准的使用者才能訪問此腳本。您需要申請並獲得使用許可,通常需在付款後才能取得。更多詳情,請依照作者以下的指示操作,或直接聯絡ScanYourStrat。
TradingView不建議在未完全信任作者並了解其運作方式的情況下購買或使用腳本。您也可以在我們的社群腳本中找到免費的開源替代方案。
作者的說明
Not working at the moment.
免責聲明
這些資訊和出版物並非旨在提供,也不構成TradingView提供或認可的任何形式的財務、投資、交易或其他類型的建議或推薦。請閱讀使用條款以了解更多資訊。
僅限邀請腳本
僅作者批准的使用者才能訪問此腳本。您需要申請並獲得使用許可,通常需在付款後才能取得。更多詳情,請依照作者以下的指示操作,或直接聯絡ScanYourStrat。
TradingView不建議在未完全信任作者並了解其運作方式的情況下購買或使用腳本。您也可以在我們的社群腳本中找到免費的開源替代方案。
作者的說明
Not working at the moment.
免責聲明
這些資訊和出版物並非旨在提供,也不構成TradingView提供或認可的任何形式的財務、投資、交易或其他類型的建議或推薦。請閱讀使用條款以了解更多資訊。