Range Bar Gaps DetectorRange Bar Gaps Detector
Overview
The Range Bar Gaps Detector identifies price gaps across multiple range bar sizes (12, 24, 60, and 120) on any trading instrument, helping traders spot potential support/resistance zones or breakout opportunities. Designed for Pine Script v6, this indicator detects gaps on range bars and exports data for use in companion scripts like Range Bar Gaps Overlap, making it ideal for multi-timeframe gap analysis.
Key Features
Multi-Range Gap Detection: Identifies gaps on 12, 24, 60, and 120-range bars, capturing both bullish (gap up) and bearish (gap down) price movements.
Customizable Sensitivity: Includes a user-defined minimum deviation (default: 10% of 14-period SMA) for 12-range gaps to filter out noise.
7-Day Lookback: Automatically prunes gaps older than 7 days to focus on recent, relevant price levels.
Data Export: Serializes up to 10 gaps per range (tops, bottoms, start bars, highest/lowest prices, and age) for seamless integration with overlap analysis scripts.
Debugging Support: Plots gap counts and aggregation data in the Data Window for easy verification of detected gaps.
How It Works
The indicator aggregates price movements to simulate higher range bars (24, 60, 120) from a base range bar chart. It detects gaps when the price jumps significantly between bars, ensuring gaps meet the minimum deviation threshold for 12-range bars. Gaps are stored in arrays, serialized for external use, and pruned after 7 days to maintain efficiency.
Usage
Add to your range bar chart (e.g., 12-range) to detect gaps across multiple ranges.
Use alongside the Range Bar Gaps Overlap indicator to visualize gaps and their overlaps as boxes on the chart.
Check the Data Window to confirm gap counts and sizes for each range (12, 24, 60, 120).
Adjust the "Minimal Deviation (%) for 12-Range" input to control gap detection sensitivity.
Settings
Minimal Deviation (%) for 12-Range: Set the minimum gap size for 12-range bars (default: 10% of 14-period SMA).
Range Sizes: Fixed at 24, 60, and 120 for higher range bar aggregation.
Notes
Ensure the script is published under your TradingView username (e.g., GreenArrow2005) for use with companion scripts.
Best used on range bar charts to maintain consistent gap detection.
For advanced overlap analysis, pair with the Range Bar Gaps Overlap indicator to highlight zones where gaps from different ranges align.
Ideal For
Traders seeking to identify key price levels for support/resistance or breakout strategies.
Multi-timeframe analysts combining gap data across various range bar sizes.
Developers building custom indicators that leverage gap data for advanced charting.
樞軸點和水平

High/Low of Previous 3 Days & Daily Open (Frame-Independent)High/Low of Previous 3 Days & Daily Open
This indicator automatically plots:
The highest high and lowest low of the previous 3 trading days (excluding today),
Today’s daily open,
And shows a clear “Buy chủ đạo” (Strong Buy) label if price closes above the 3D-High,
Or a “Sell chủ đạo” (Strong Sell) label if price closes below the 3D-Low.
Key advantages:
Always calculates the true 3-day range on any timeframe (not just 3 bars),
Instantly highlights breakout zones for strong trend trading,
Simple, clean, and highly effective for both breakout and trend-following traders.
Just add it to your chart and watch for strong moves whenever price breaks out of the recent 3-day range!

Machine Learning Key Levels [AlgoAlpha]🟠 OVERVIEW
This script plots Machine Learning Key Levels on your chart by detecting historical pivot points and grouping them using agglomerative clustering to highlight price levels with the most past reactions. It combines a pivot detection, hierarchical clustering logic, and an optional silhouette method to automatically select the optimal number of key levels, giving you an adaptive way to visualize price zones where activity concentrated over time.
🟠 CONCEPTS
Agglomerative clustering is a bottom-up method that starts by treating each pivot as its own cluster, then repeatedly merges the two closest clusters based on the average distance between their members until only the desired number of clusters remain. This process creates a hierarchy of groupings that can flexibly describe patterns in how price reacts around certain levels. This offers an advantage over K-means clustering, since the number of clusters does not need to be predefined. In this script, it uses an average linkage approach, where distance between clusters is computed as the average pairwise distance of all contained points.
The script finds pivot highs and lows over a set lookback period and saves them in a buffer controlled by the Pivot Memory setting. When there are at least two pivots, it groups them using agglomerative clustering: it starts with each pivot as its own group and keeps merging the closest pairs based on their average distance until the desired number of clusters is left. This number can be fixed or chosen automatically with the silhouette method, which checks how well each point fits in its cluster compared to others (higher scores mean cleaner separation). Once clustering finishes, the script takes the average price of each cluster to create key levels, sorts them, and draws horizontal lines with labels and colors showing their strength. A metrics table can also display details about the clusters to help you understand how the levels were calculated.
🟠 FEATURES
Agglomerative clustering engine with average linkage to merge pivots into level groups.
Dynamic lines showing each cluster’s price level for clarity.
Labels indicating level strength either as percent of all pivots or raw counts.
A metrics table displaying pivot count, cluster count, silhouette score, and cluster size data.
Optional silhouette-based auto-selection of cluster count to adaptively find the best fit.
🟠 USAGE
Add the indicator to any chart. Choose how far back to detect pivots using Pivot Length and set Pivot Memory to control how many are kept for clustering (more pivots give smoother levels but can slow performance). If you want the script to pick the number of levels automatically, enable Auto No. Levels ; otherwise, set Number of Levels . The colored horizontal lines represent the calculated key levels, and circles show where pivots occurred colored by which cluster they belong to. The labels beside each level indicate its strength, so you can see which levels are supported by more pivots. If Show Metrics Table is enabled, you will see statistics about the clustering in the corner you selected. Use this tool to spot areas where price often reacts and to plan entries or exits around levels that have been significant over time. Adjust settings to better match volatility and history depth of your instrument.

👽 TIME PERIODS👽 TIME PERIODS v1.15
Visualize key time divisions and session levels on any chart:
• Timezone‐aware session shading
– Highlight active NY session (configurable HHMM–HHMM and days)
– Adjustable background opacity
• Weekly & Monthly Separators
– Toggle on/off
– Custom color, style (solid/dashed/dotted) & width
• Day-of-Week Labels
– Diamonds at session start for M–S
– Toggle on/off
• Session Open Line
– Horizontal line at each session’s open
– Configurable color, width & “distanceRight” in bars
– Always shows current session
• Midpoint Vertical Line
– Plots halfway between session open & close
– Custom color, style & width
– Toggle on/off
▶ All elements grouped for easy parameter tweaking
▶ Fully timezone-configurable (default America/New_York)
▶ Version 1.15 — added distanceRight feature & current session support
Use this to see exactly where your chosen session, weekly/monthly boundaries, and intraday pivot points fall—across any timeframe.

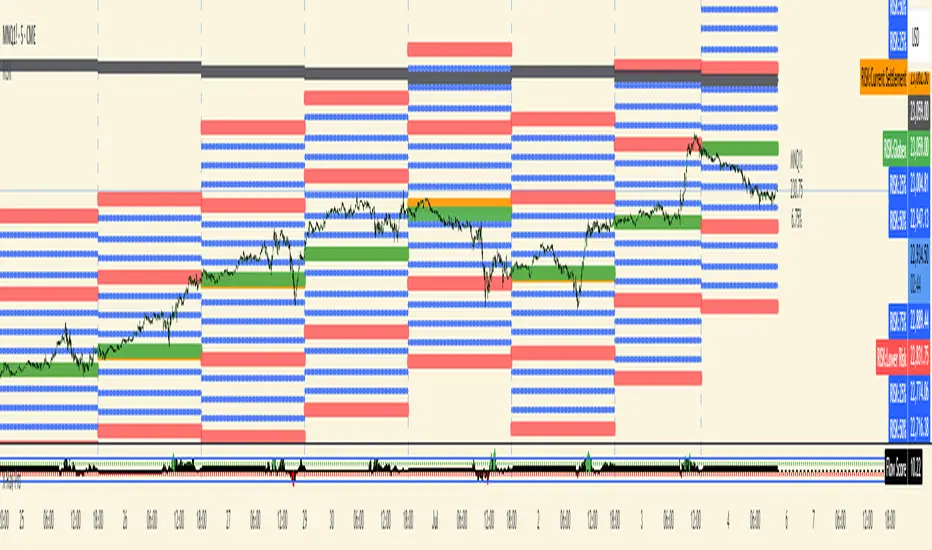
RISK## Main Purpose
The indicator calculates and displays risk levels based on margin requirements and daily settlement prices, helping traders visualize their potential risk exposure.
## Key Features
**Inputs:**
- **Margin for Calculation**: The CME long margin requirement for the asset
- **HTF Margin Line**: An anchor point for higher timeframe margin calculations
**Core Calculations:**
1. **Settlement Price Tracking**: Captures daily settlement prices during specific session times (6:58-6:59 PM ET for close, 6:00-6:01 PM ET for new day open)
2. **Risk Percentage**: Calculates `margin / (point value × settlement price)` - with special handling for Micro contracts (symbols starting with "M") that uses 10× point value
3. **Risk Intervals**: Determines price intervals representing one margin unit of risk
## Visual Display
The indicator plots multiple risk levels on the chart:
- **Settlement price** (orange circles)
- **Globex open** (green circles)
- **Upper/Lower Risk levels** (red circles) - one and two risk intervals away
- **Subdivision levels** (blue crosses) - 25%, 50%, and 75% of each risk interval
- **MHP+ level** (black crosses) - HTF anchor adjusted by risk percentage
- **HTF Anchor** (black crosses)
## Practical Use
This helps futures traders:
- Visualize how far price can move before hitting margin calls
- See risk levels relative to daily settlements
- Plan position sizing and risk management
- Understand exposure in terms of actual margin requirements
The indicator essentially transforms abstract margin numbers into concrete price levels on the chart, making risk management more visual and intuitive.
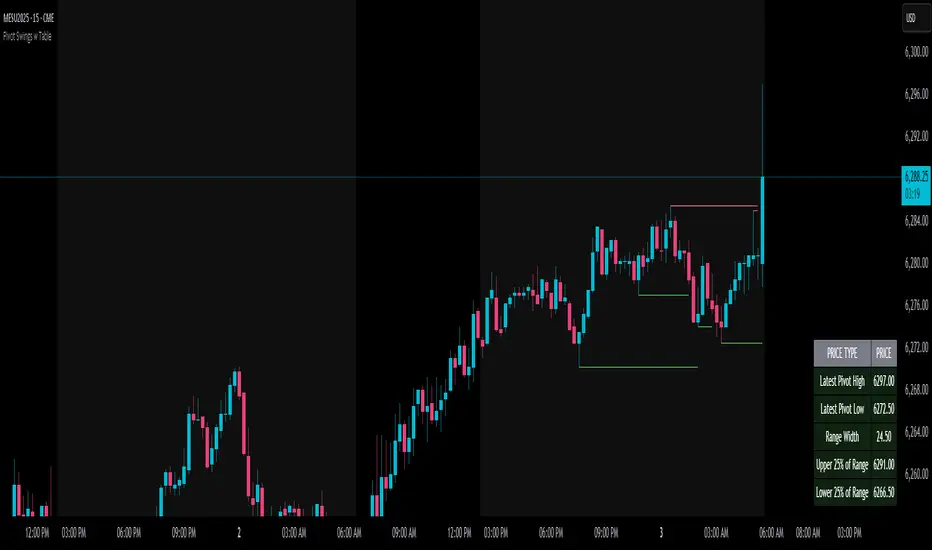
Pivot Swings w Table Pivot Swings w Table — Intraday Structure & Range Analyzer
This indicator identifies key pivot highs and lows on the chart and highlights market structure shifts using a real-time table display. It helps traders visually confirm potential trade setups by tracking unbroken swing points and measuring the range between the most recent pivots.
🔍 Features:
🔹 Automatic Pivot Detection using configurable left/right bar logic.
🔹 Unbroken Pivot Filtering — only pivots that haven't been invalidated by price are displayed.
🔹 Dynamic Range Table with:
Latest valid Pivot High and Pivot Low
Total Range Width
Upper & Lower 25% range thresholds (useful for value/imbalance analysis)
🔹 Trend-Based Color Coding — the table background changes based on which pivot (high or low) occurred more recently:
🟥 Red: Downward bias (last pivot was a lower high)
🟩 Green: Upward bias (last pivot was a higher low)
🔹 Optional extension of pivot levels to the right of the chart for support/resistance confluence.
⚙️ How to Use:
Adjust the Left Bars and Right Bars inputs to fine-tune how swings are defined.
Look for price reacting near the Upper or Lower 25% zones to anticipate mean reversion or breakout setups.
Use the trend color of the table to confirm directional bias, especially useful during consolidation or retracement periods.
💡 Best For:
Intraday or short-term swing traders
Traders who use market structure, support/resistance, or trend-based strategies
Those looking to avoid low-quality trades in tight ranges
✅ Built for overlay use on price charts
📈 Works on all symbols and timeframes
🧠 No repainting — pivots are confirmed with completed bars
Liquidity Zone IndicatorLiquidity Zone Indicator
This PineScript indicator for TradingView identifies liquidity zones in the market where significant trading activity occurs, based on volume spikes and price levels. It highlights areas where large orders may be filled, useful for day traders and scalpers.
Features:
Detects bullish and bearish liquidity zones using a lookback period (default: 50 bars) and volume threshold (default: 1.5x average volume).
Displays zones as shaded boxes or diamond markers above/below bars, customizable by color.
Option to extend zones until price breaks through, with dynamic transparency for better visualization.
Includes an alert for when a liquidity zone is hit.
Settings:
Liquidity Lookback: Number of bars to analyze for high/low price levels.
Volume Threshold: Multiplier for detecting volume spikes.
Display as Zone: Toggle between zone boxes or markers.
Extend Zone: Keep zones active until price crosses them.
Zone Color: Customize the color of zones or markers.
Ideal for traders looking to spot potential reversal or breakout areas driven by liquidity.

Recuadro 06:00–07:30 NY extendido hasta 11:00 con DRDefining Range 6:00 am -7:30 am NY time
This indicator includes the daily range between 6:00am -7:30 am according to quarterly Theory

Dhokiya's 0.09% IndicatorThis is a custom indicator for predicting the levels on NSE:NIFTY chart for day trading. More strategy details will be updated soon.
(WIP)
- Rahul Dhangar

Initial Balance Wave Map📊 Initial Balance Wave Map – Powered by VWAP Wave
The Initial Balance Wave Map is your visual roadmap for navigating the first hour of trading like a pro. Built to align with the VWAP Wave System, this indicator automatically plots the Initial Balance (IB) high and low, calculates real-time IB extensions, and layers in key midpoints and volume-based structure to map out high-probability zones for both reversals and breakouts. This upgraded indicator builds upon the open-source foundation by @noop-noop, with enhancements and user-facing labels tailored for Auction Market Theory, scalping, and structure-based trade setups.
🔍 Key Features:
✅ Automatically plots IB High/Low based on session times (customizable)
🔁 Displays +1x / +2x IB extensions and midpoints for precision targeting
📐 Integrated with VWAP Wave strategy: use with deviation bands for full context
🎯 Works across futures, forex, and crypto — universal structure map
🎨 Optional visual highlights for calculation window and labeling
💡 How to Use:
Fade setups: Look for price rejection at ±1x or ±2x IB extensions inside a balanced market.
Breakout setups: Combine IB breaks with VWAP Wave price discovery for high-momentum plays.
Return to value: When price rejects extension levels and rotates, target the IB midpoint or VWAP.
Whether you’re scalping futures like NQ & ES, swinging gold, or analyzing forex pairs, the Initial Balance Wave Map gives you the structural clarity to react instead of guess.
For more information, visit vwapwave.com and find the VWAP Wave System official published book on Amazon.com .
🙌 Credits:
This script builds upon the excellent open-source work by @noop-noop. Original script available here .

NFP RangesThis simple indicator will mark the high and low prices during NFP days. You an choose how many NFP days you want to go back and a gradient to use for the levels.
The NFP dates are hard coded from 2023 through 2029. If this script survives past 2029, it should be simple to add more dates.


OTE+STDV MultiTF IndicatorVERY ROUGH DRAFT OF INDICATOR EXPECTS BUGS. I AM NOT A CODER SO THIS SHOULD NOT BE PERFECT.
Place limit orders on yellow lines. You will get a buy signal only during perfect A+ setups.
PLEASE MESSAGE ME IF YOU ARE A CODER AND CAN FIX THIS OR MAKE IT BETTER
Discord: itscwiby
Orange Lines are Rejection Zones
Yellow Lines are Limit order spots. Usually you want to take this with a 40 tick SL. You can also use a Fib tool on the green box to get a better entry.
Generally you want to look at the 30m chart or higher for these zones and find a optimal entry on a smaller timeframe.

Multi-TF Candle Close - PROPTRADERZ Draws a horizontal ray at the close of the last completed candle from a selectable timeframe (e.g. 1m, 5m, 15m), regardless of your current chart. Includes optional price label with offset for better visibility on short-term charts like 15s or 5s. Great for multi-timeframe traders.

TICK ±1200 Intrabar MarkerMarks +1100 and -1200 NYSE TICK readings on any chart. Useful for TICK fades without having to look at the actual USI:TICK chart.

Intraday Session Levels: Pre-Mkt, 5m, 15m (Replay/Toggle/Labels)Intraday Session Levels: Pre-Mkt, 5m, 15m (Replay/Toggle/Labels)
Version v1.0
Live session levels for every trader!
This indicator automatically tracks and draws the most actionable intraday levels as they develop—live in real-time and fully compatible with TradingView’s bar replay and backtesting.
How it works:
Pre-Market High & Low:
Levels appear and update live as soon as the pre-market session starts (4:00am ET), then “freeze” at the official open (9:30am ET) and remain visible for the rest of the day.
First 5-Minute Candle High/Low:
Drawn instantly after the first 5-minute candle (9:30–9:35am ET) completes.
First 15-Minute Candle High/Low:
Drawn right after the first 15-minute candle (9:30–9:45am ET) completes.
Labels on every line
Each level is clearly labeled on your chart (“PreMkt High”, “5m Low”, “15m High”, etc).
Perfect for backtesting:
All levels display exactly as they would have appeared in real time, making this indicator fully bar replay and historical test compatible.
Flexible ON/OFF toggles:
Instantly show or hide Pre-Mkt, 5m, and 15m levels via the settings panel.
Why use it?
Identify support/resistance and key reaction zones intraday
Fade or break the opening range with confidence
Backtest your strategies with accurate historical context
Reduce chart clutter with customizable, minimal visuals
Whether you’re a scalper, day trader, or backtest enthusiast, this tool keeps your charts focused and your edge sharp.
Developed by

Last 10 Sessions: High, Low, Pivot, GapLast 10 Sessions: High, Low, Pivot, Gap
This indicator highlights the most important price levels from the last 10 completed trading sessions to help intraday and swing traders quickly spot potential support, resistance, and price reaction zones.
Key Features:
Previous Highs and Lows : Visualize the high and low from each of the past 10 sessions. These are the most commonly tested breakout and reversal points for day trading.
Session Pivots: The classic pivot formula ((High + Low + Close) / 3) for each of the last 10 sessions, often acting as a market “equilibrium” or intraday magnet.
Gaps: Displays the difference between each day’s open and the previous session’s close (“gap”), showing sentiment shifts and possible gap fill targets.
Clean, Faded Visuals: All lines and labels are subtly faded so your chart remains clear and uncluttered, with each level labeled by how many sessions ago it occurred.
Full Customization: Instantly toggle any level type (High, Low, Pivot, Gap) ON/OFF in settings, extend lines to the right, and adjust their forward length.
Bulletproof Logic: Never throws runtime errors. Lines and labels only display when valid data is present.
How to Use:
Use recent highs/lows for breakout, breakdown, or mean reversion trades.
Spot where multiple levels from past sessions cluster together for high-probability reversal or breakout areas.
Watch pivots for intraday bias, and gaps for sentiment and possible fill plays.
Perfect for all intraday timeframes.
If you want a powerful yet minimal map of where price is most likely to react, this indicator is for you!
Developed by

Last 10 Sessions: High, Low, Pivot, GapLast 10 Sessions: High, Low, Pivot, Gap
Version: v1.0
Developed by
This indicator highlights the most important price levels from the last 10 completed trading sessions to help intraday and swing traders quickly spot potential support, resistance, and price reaction zones.
Key Features:
Previous Highs and Lows: Visualize the high and low from each of the past 10 sessions. These are the most commonly tested breakout and reversal points for day trading.
Session Pivots: The classic pivot formula ((High + Low + Close) / 3) for each of the last 10 sessions, often acting as a market “equilibrium” or intraday magnet.
Gaps: Displays the difference between each day’s open and the previous session’s close (“gap”), showing sentiment shifts and possible gap fill targets.
Clean, Faded Visuals: All lines and labels are subtly faded so your chart remains clear and uncluttered, with each level labeled by how many sessions ago it occurred.
Full Customization: Instantly toggle any level type (High, Low, Pivot, Gap) ON/OFF in settings, extend lines to the right, and adjust their forward length.
Bulletproof Logic: Never throws runtime errors. Lines and labels only display when valid data is present.
How to Use:
Use recent highs/lows for breakout, breakdown, or mean reversion trades.
Spot where multiple levels from past sessions cluster together for high-probability reversal or breakout areas.
Watch pivots for intraday bias, and gaps for sentiment and possible fill plays.
Perfect for all intraday timeframes.
If you want a powerful yet minimal map of where price is most likely to react, this indicator is for you!

Hidden Bearish Divergence [1H]Detects Hidden Bearish Divergence on the 1-hour timeframe using RSI. This is the opposite of hidden bullish — it suggests bearish continuation in a downtrend. Price forms a Lower High. RSI forms a Higher High. Suggests bearish continuation (ideal in a downtrend).

Hidden Bullish Divergence [1H]Detects hidden bullish divergence on the 1-hour timeframe using RSI. It will plot a label when conditions are met. Watch for the green label under a candle — this indicates hidden bullish divergence.

Volumatic Support/Resistance Levels [BigBeluga]🔵 OVERVIEW
A smart volume-powered tool for identifying key support and resistance zones—enhanced with real-time volume histogram fills and high-volume markers.
Volumatic Support/Resistance Levels detects structural levels from swing highs and lows, and wraps them in dynamic histograms that reflect the relative volume strength around those zones. It highlights the strongest price levels not just by structure—but by the weight of market participation.
🔵 CONCEPTS
Price Zones: Support and resistance levels are drawn from recent price pivots, while volume is used to visually enhance these zones with filled histograms and highlight moments of peak activity using markers.
Histogram Fill = Activity Zone: The width and intensity of each filled zone adjusts to recent volume bursts.
High-Volume Alerts: Circle markers highlight moments of volume dominance directly on the levels—revealing pressure points of support/resistance.
Clean Visual Encoding: Red = resistance zones, green = support zones, orange = high-volume bars.
🔵 FEATURES
Detects pivot-based resistance (highs) and support (lows) using a customizable range length.
Wraps these levels in volume-weighted bands that expand/contract based on percentile volume.
Color fill intensity increases with rising volume pressure, creating a live histogram feel.
When volume > user-defined threshold , the indicator adds circle markers at the top and bottom of that price level zone.
Bar coloring highlights the candles that generated this high-volume behavior (orange by default).
Adjustable settings for all thresholds and colors, so traders can dial in volume sensitivity.
🔵 HOW TO USE
Identify volume-confirmed resistance and support zones for potential reversal or breakout setups.
Focus on levels with intense histogram fill and circle markers —they indicate strong participation.
Use bar coloring to track when key activity started and align it with broader market context.
Works well in combination with order blocks, trend indicators, or liquidity zones.
Ideal for day traders, scalpers, and volume-sensitive setups.
🔵 CONCLUSION
Volumatic Support/Resistance Levels elevates traditional support and resistance logic by anchoring it in volume context. Instead of relying solely on price action, it gives traders insight into where real conviction lies—by mapping how aggressively the market defended or rejected key levels. It's a visual, reactive, and volume-conscious upgrade to your structural toolkit.

Daily Balance Point (Ray + Axis Price Only)This tool helps traders visually track the most important level of the day to plan smart trades based on price action, rejections, or breakouts from the balance point. By Fahad Malik FM Forex Academy ✅

Optimized Bayesian Network Signal (Tunable)Built for short set-up in the NY Session. it uses a bayesian network with adjustable candlestick look-back period.
MACD
RSI
Volume sensitivity settings.
