OPEN-SOURCE SCRIPT
Monthly Price Insights V1 [PINESCRIPTLABS]
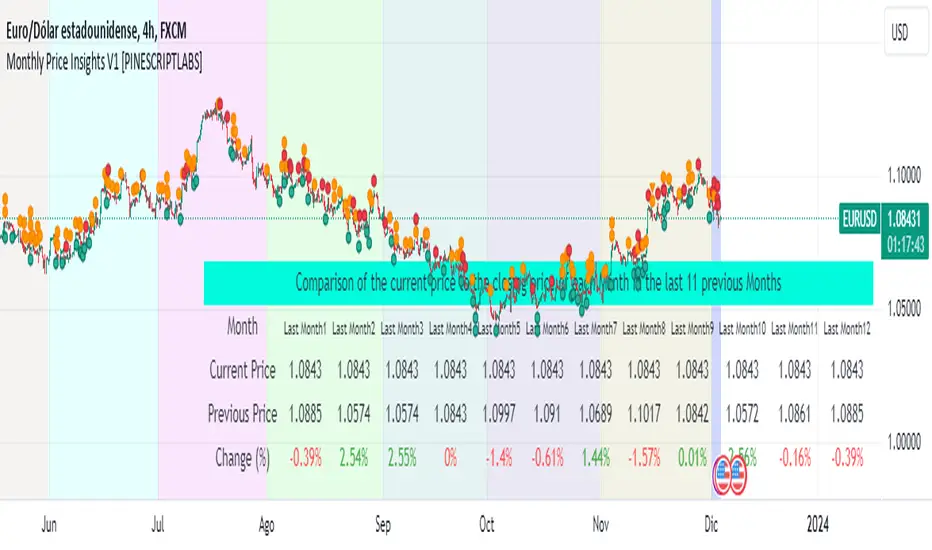
This indicator displays a chart table that compares the current price of the asset with the closing prices of the last 12 months. This table includes columns for the month, the current price, the previous price, and the percentage change.

Monthly Color Visualization: The indicator uses unique colors for each month, facilitating quick identification of the current and previous periods on the trading chart.

Calculation of Percentage Changes: The indicator calculates the percentage change in price from the previous month, providing a clear perspective on the price trend over time.
Dynamic Data Update: It automatically updates to reflect changes in the asset's price.

Español:
Este indicador muestra una tabla en el gráfico que compara el precio actual del activo con los precios de cierre de los últimos 12 meses. Esta tabla incluye columnas para el mes, el precio actual, el precio anterior y el cambio porcentual.
[imagen][/imagen]
Visualización por Colores Mensuales: El indicador utiliza colores únicos para cada mes, facilitando la identificación rápida del periodo actual y los anteriores en el gráfico de trading.
[imagen][/imagen]
Cálculo de Cambios Porcentuales: El indicador calcula el cambio porcentual en el precio desde el mes anterior, proporcionando una perspectiva clara de la tendencia del precio a lo largo del tiempo.
Actualización Dinámica de Datos: Se actualiza automáticamente para reflejar los cambios en el precio del activo.
[imagen][/imagen]
Monthly Color Visualization: The indicator uses unique colors for each month, facilitating quick identification of the current and previous periods on the trading chart.
Calculation of Percentage Changes: The indicator calculates the percentage change in price from the previous month, providing a clear perspective on the price trend over time.
Dynamic Data Update: It automatically updates to reflect changes in the asset's price.
Español:
Este indicador muestra una tabla en el gráfico que compara el precio actual del activo con los precios de cierre de los últimos 12 meses. Esta tabla incluye columnas para el mes, el precio actual, el precio anterior y el cambio porcentual.
[imagen]
Visualización por Colores Mensuales: El indicador utiliza colores únicos para cada mes, facilitando la identificación rápida del periodo actual y los anteriores en el gráfico de trading.
[imagen]
Cálculo de Cambios Porcentuales: El indicador calcula el cambio porcentual en el precio desde el mes anterior, proporcionando una perspectiva clara de la tendencia del precio a lo largo del tiempo.
Actualización Dinámica de Datos: Se actualiza automáticamente para reflejar los cambios en el precio del activo.
[imagen]
開源腳本
秉持TradingView一貫精神,這個腳本的創作者將其設為開源,以便交易者檢視並驗證其功能。向作者致敬!您可以免費使用此腳本,但請注意,重新發佈代碼需遵守我們的社群規範。
免責聲明
這些資訊和出版物並非旨在提供,也不構成TradingView提供或認可的任何形式的財務、投資、交易或其他類型的建議或推薦。請閱讀使用條款以了解更多資訊。
免責聲明
這些資訊和出版物並非旨在提供,也不構成TradingView提供或認可的任何形式的財務、投資、交易或其他類型的建議或推薦。請閱讀使用條款以了解更多資訊。