INVITE-ONLY SCRIPT
已更新 CandelaCharts - OHLC Session Range Map
📝 Overview
Master the art of candlestick analysis with the OHLC Session Range Map!
Enhance your TradingView strategies by incorporating this advanced tool for actionable insights. Far beyond standard OHLC visuals, this innovative indicator integrates Inner Circle Trader (ICT) concepts to analyze accumulation, manipulation, and distribution, one candle at a time.
ICT traders identify manipulation through wicks that extend opposite the candle’s close—a tactic designed to mislead market participants into taking positions in the "wrong" direction. These movements often signify potential manipulation phases. By interpreting these signals, traders can anticipate a candle’s distribution phase, where the price expands to higher or lower levels. This provides valuable insights into liquidity targets, retracement zones, and potential reversals.

These levels provide critical insights into order flow, illustrating how price interacts with them and the sequence in which it unfolds.
To refine price analysis further, the tool also tracks the average timing for the completion of manipulation and distribution phases. By combining historical timing patterns with price levels tied to these phases, traders can perform more in-depth analyses and enhance their market strategies.
While rooted in historical data, this indicator does not guarantee that past patterns will repeat in future market conditions. Instead, it offers a data-driven approach to identifying moments when candles are likely to reverse after manipulation phases or retrace following completed distributions, enabling traders to spot potential turning points with greater precision.
📦 Features
This tool offers a range of powerful features to enhance your trading analysis:
⚙️ Settings
⚡️ Showcase
Here’s a visual showcase of the tool in action, highlighting its key features and capabilities:
Manipilation & Distribution

Time

📒 Usage
Here’s how you can use the OHLC Session Range Map to enhance your analysis:
Example 1

Example 2

By following these steps, you'll unlock powerful insights to refine and elevate your trading strategies.
🔹 Notes
On Bullish candles:
On Bearish candles:
Available calculation methods:
Price patterns on OHLC Session Range Map:
🚨 Alerts
The indicator does not provide any alerts!
⚠️ Disclaimer
These tools are exclusively available on the TradingView platform.
Our charting tools are intended solely for informational and educational purposes and should not be regarded as financial, investment, or trading advice. They are not designed to predict market movements or offer specific recommendations. Users should be aware that past performance is not indicative of future results and should not rely on these tools for financial decisions. By using these charting tools, the purchaser agrees that the seller and creator hold no responsibility for any decisions made based on information provided by the tools. The purchaser assumes full responsibility and liability for any actions taken and their consequences, including potential financial losses or investment outcomes that may result from the use of these products.
By purchasing, the customer acknowledges and accepts that neither the seller nor the creator is liable for any undesired outcomes stemming from the development, sale, or use of these products. Additionally, the purchaser agrees to indemnify the seller from any liability. If invited through the Friends and Family Program, the purchaser understands that any provided discount code applies only to the initial purchase of Candela's subscription. The purchaser is responsible for canceling or requesting cancellation of their subscription if they choose not to continue at the full retail price. In the event the purchaser no longer wishes to use the products, they must unsubscribe from the membership service, if applicable.
We do not offer reimbursements, refunds, or chargebacks. Once these Terms are accepted at the time of purchase, no reimbursements, refunds, or chargebacks will be issued under any circumstances.
By continuing to use these charting tools, the user confirms their understanding and acceptance of these Terms as outlined in this disclaimer.
Master the art of candlestick analysis with the OHLC Session Range Map!
Enhance your TradingView strategies by incorporating this advanced tool for actionable insights. Far beyond standard OHLC visuals, this innovative indicator integrates Inner Circle Trader (ICT) concepts to analyze accumulation, manipulation, and distribution, one candle at a time.
ICT traders identify manipulation through wicks that extend opposite the candle’s close—a tactic designed to mislead market participants into taking positions in the "wrong" direction. These movements often signify potential manipulation phases. By interpreting these signals, traders can anticipate a candle’s distribution phase, where the price expands to higher or lower levels. This provides valuable insights into liquidity targets, retracement zones, and potential reversals.
These levels provide critical insights into order flow, illustrating how price interacts with them and the sequence in which it unfolds.
To refine price analysis further, the tool also tracks the average timing for the completion of manipulation and distribution phases. By combining historical timing patterns with price levels tied to these phases, traders can perform more in-depth analyses and enhance their market strategies.
While rooted in historical data, this indicator does not guarantee that past patterns will repeat in future market conditions. Instead, it offers a data-driven approach to identifying moments when candles are likely to reverse after manipulation phases or retrace following completed distributions, enabling traders to spot potential turning points with greater precision.
📦 Features
This tool offers a range of powerful features to enhance your trading analysis:
- Average Range Accuracy: Simplify candlestick analysis with advanced lines and labels to pinpoint manipulation, distribution, and time pivots. Graph average ranges for your chosen timeframe to navigate market volatility and uncover key support and resistance zones.
- Custom Timeframe Selection: Align your analysis with your trading strategy by choosing a timeframe that highlights the candle’s manipulation, distribution, and key timing.
- Real-time Data Feed: Stay updated with live candlestick stats, with each new candle updating OHLC data and performing ongoing historical calculations, even on sub-minute timeframes.
- Historical Mapping: Backtest past market scenarios with ease using the historical mapping feature. Traders can revisit and analyze previous data, refine strategies, and customize label displays for journaling flexibility.
- User-Friendly Interface: Designed for advanced traders, the intuitive interface allows easy navigation and customization of display settings, offering a personalized experience for data-driven analysis.
⚙️ Settings
- Sessions: Sets the timeframe to which will be drawn.
- Lookback: Controls period length in days.
- Method: Sets the desired calculation algorithm.
- History: Display Session Range Map drawings for previous sessions.
- Timezone: Dsiplay the data based on the selected timezone.
- Opn: Style for Open line.
- Man: Style for Manipulation line.
- Dis: Style for Distribution line.
- Time: Style for Timeline.
- Labels: Controls the size and abbreviations.
- Table Position: Manage the Session Range Map table position
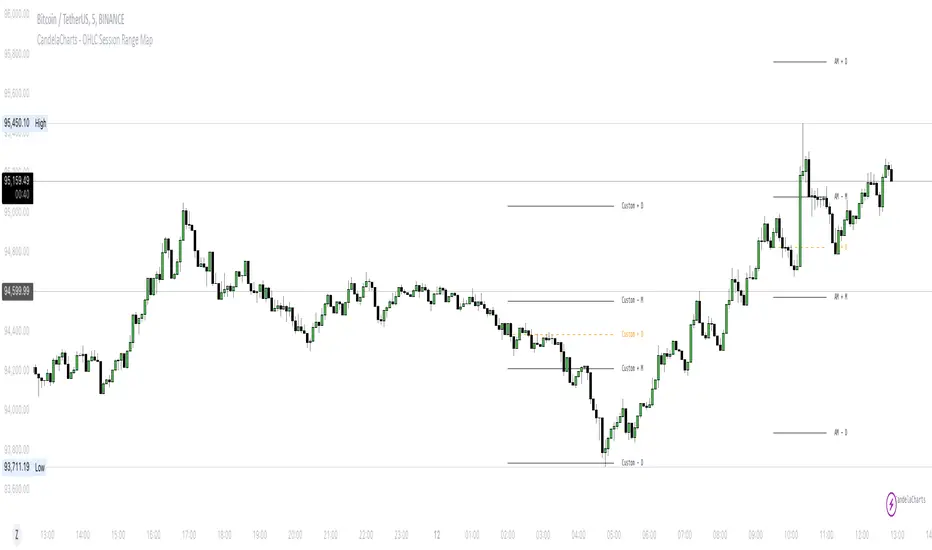
⚡️ Showcase
Here’s a visual showcase of the tool in action, highlighting its key features and capabilities:
Manipilation & Distribution
Time
📒 Usage
Here’s how you can use the OHLC Session Range Map to enhance your analysis:
- Add OHLC Session Range Map to your Tradingview chart.
- Select a timeframe and customize the styles to fit your preferences.
- Watch as calculated manipulation, distribution, and delivery times align with your analysis.
- Combine this data with other models and insights to strengthen your trading strategy.
Example 1
Example 2
By following these steps, you'll unlock powerful insights to refine and elevate your trading strategies.
🔹 Notes
On Bullish candles:
- Manipulation: Open - Low
- Distribution: Open - High
On Bearish candles:
- Manipulation: Open - High
- Distribution: Open - Low
Available calculation methods:
- Mean
- Median
Price patterns on OHLC Session Range Map:
- Open - -Man - +Dis
- Open - -Man - Open - +Dis
- Open - -Man - +Man - +Dis
- Open - -Man - +Man - -Dis
- Open - +Man - -Dis
- Open - +Man - Open - -Dis
- Open - +Man - -Man - -Dis
- Open - +Man - -Man - +Dis
🚨 Alerts
The indicator does not provide any alerts!
⚠️ Disclaimer
These tools are exclusively available on the TradingView platform.
Our charting tools are intended solely for informational and educational purposes and should not be regarded as financial, investment, or trading advice. They are not designed to predict market movements or offer specific recommendations. Users should be aware that past performance is not indicative of future results and should not rely on these tools for financial decisions. By using these charting tools, the purchaser agrees that the seller and creator hold no responsibility for any decisions made based on information provided by the tools. The purchaser assumes full responsibility and liability for any actions taken and their consequences, including potential financial losses or investment outcomes that may result from the use of these products.
By purchasing, the customer acknowledges and accepts that neither the seller nor the creator is liable for any undesired outcomes stemming from the development, sale, or use of these products. Additionally, the purchaser agrees to indemnify the seller from any liability. If invited through the Friends and Family Program, the purchaser understands that any provided discount code applies only to the initial purchase of Candela's subscription. The purchaser is responsible for canceling or requesting cancellation of their subscription if they choose not to continue at the full retail price. In the event the purchaser no longer wishes to use the products, they must unsubscribe from the membership service, if applicable.
We do not offer reimbursements, refunds, or chargebacks. Once these Terms are accepted at the time of purchase, no reimbursements, refunds, or chargebacks will be issued under any circumstances.
By continuing to use these charting tools, the user confirms their understanding and acceptance of these Terms as outlined in this disclaimer.
發行說明
CandelaCharts - OHLC Session Range Map 1.0.1- Add table visualization
- Minor bug fixing
發行說明
CandelaCharts - OHLC Session Range Map 1.0.2- Increase buffer calculations
發行說明
CandelaCharts - OHLC Session Range Map 1.0.3- New liquidity levels feature
- New KDE calculation method
- Bug fixing
僅限邀請腳本
只有經作者授權的使用者才能訪問此腳本,且通常需付費。您可以將此腳本加入收藏,但需先向作者申請並獲得許可後才能使用 — 點擊此處了解更多。如需更多詳情,請依照作者說明或直接聯繫CandelaCharts。
除非您完全信任其作者並了解腳本的工作原理,否則TradingView不建議您付費或使用腳本。您也可以在我們的社群腳本中找到免費的開源替代方案。
作者的說明
Explore all CandelaCharts indicators at: https://www.candelacharts.com/. Connect with our community on Discord: https://discord.gg/etGSTepqbu. All scripts and content provided by CandelaCharts are intended for informational and educational purposes only.
提醒:在請求訪問權限之前,請閱讀僅限邀請腳本指南。
Get access to our exclusive tools: candelacharts.com
Join our community: discord.gg/etGSTepqbu
All content provided by CandelaCharts is for informational & educational purposes only.
Join our community: discord.gg/etGSTepqbu
All content provided by CandelaCharts is for informational & educational purposes only.
免責聲明
這些資訊和出版物並不意味著也不構成TradingView提供或認可的金融、投資、交易或其他類型的意見或建議。請在使用條款閱讀更多資訊。