PROTECTED SOURCE SCRIPT
🔁 Signal-to-Signal Reverse Indicator

🔁 Signal-to-Signal Reverse Indicator
Overview
The Signal-to-Signal Reverse Indicator is a precision trend-trading tool designed for clean reversal entries with enhanced filtering logic. It identifies bullish and bearish trend shifts using a combination of EMA crossovers, RSI zones, ADX strength confirmation, and a wick/retest validation logic. Ideal for traders who aim to ride significant swings and avoid fakeouts.
Key Features
- 🔄 Signal-to-signal directional reversals with clean entries
- 📉 EMA-based trend identification (fast & slow)
- 💪 ADX confirmation for trend strength
- 🎯 RSI filters with extreme zone entries (oversold/overbought)
- 🔍 No-wick and retest candle logic to filter false breakouts
- 🟢 Optional BUY/SELL label signals for added confluence
- 🧠 Entry delay filter for extra candle confirmation
- 🎯 Configurable Take Profit and Stop Loss visualization (for strategy version)
- 🧰 All parameters are fully customizable
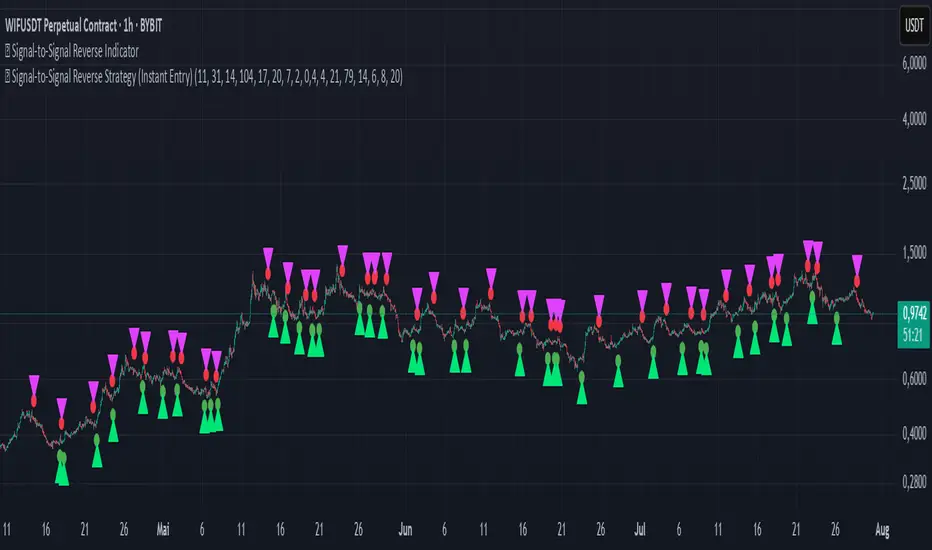
Visual Markers
- Green triangles 🔼: Long entries
- Magenta triangles 🔽: Short entries
- Small green/red circles: Detected trend changes
- Green/Red label markers: Optional BUY/SELL label trigger
Screenshot Example

Ideal Use
This indicator is ideal for intraday and swing traders looking for accurate reversal entries with visual clarity. Use it in combination with volume, Fibonacci levels, or major S/R zones to confirm high-probability setups.
---
📌 Built with ❤️ for TradingView. Developed for clarity, logic, and adaptability.
Overview
The Signal-to-Signal Reverse Indicator is a precision trend-trading tool designed for clean reversal entries with enhanced filtering logic. It identifies bullish and bearish trend shifts using a combination of EMA crossovers, RSI zones, ADX strength confirmation, and a wick/retest validation logic. Ideal for traders who aim to ride significant swings and avoid fakeouts.
Key Features
- 🔄 Signal-to-signal directional reversals with clean entries
- 📉 EMA-based trend identification (fast & slow)
- 💪 ADX confirmation for trend strength
- 🎯 RSI filters with extreme zone entries (oversold/overbought)
- 🔍 No-wick and retest candle logic to filter false breakouts
- 🟢 Optional BUY/SELL label signals for added confluence
- 🧠 Entry delay filter for extra candle confirmation
- 🎯 Configurable Take Profit and Stop Loss visualization (for strategy version)
- 🧰 All parameters are fully customizable
Visual Markers
- Green triangles 🔼: Long entries
- Magenta triangles 🔽: Short entries
- Small green/red circles: Detected trend changes
- Green/Red label markers: Optional BUY/SELL label trigger
Screenshot Example
Ideal Use
This indicator is ideal for intraday and swing traders looking for accurate reversal entries with visual clarity. Use it in combination with volume, Fibonacci levels, or major S/R zones to confirm high-probability setups.
---
📌 Built with ❤️ for TradingView. Developed for clarity, logic, and adaptability.
受保護腳本
此腳本以閉源形式發佈。 不過,您可以自由使用,沒有任何限制 — 點擊此處了解更多。
免責聲明
這些資訊和出版物並非旨在提供,也不構成TradingView提供或認可的任何形式的財務、投資、交易或其他類型的建議或推薦。請閱讀使用條款以了解更多資訊。
受保護腳本
此腳本以閉源形式發佈。 不過,您可以自由使用,沒有任何限制 — 點擊此處了解更多。
免責聲明
這些資訊和出版物並非旨在提供,也不構成TradingView提供或認可的任何形式的財務、投資、交易或其他類型的建議或推薦。請閱讀使用條款以了解更多資訊。