OPEN-SOURCE SCRIPT
已更新 Discounted Price Probability
Here is an attempt to understand the probability of discounted price of a stock by comparing it to historical price and fundamental correlation. Have made use of some of the new features of pine in developing this script (Such as matrix and new features of tables such as cell merge and tooltip).
Script makes use of the library written on matrix matrix
🎲 Process
Probability is measured in two angles
🎯 Absolute : Measure the percentile of price and fundamentals with respect to all time high. The difference between the two is measure of probability of stock being undervalued.
🎯 Drawdown : Measure the percentile of distance from all time high for both price and fundamentals. The difference between the two is used for depicting the probability of stock being undervalued.
🎲 Components
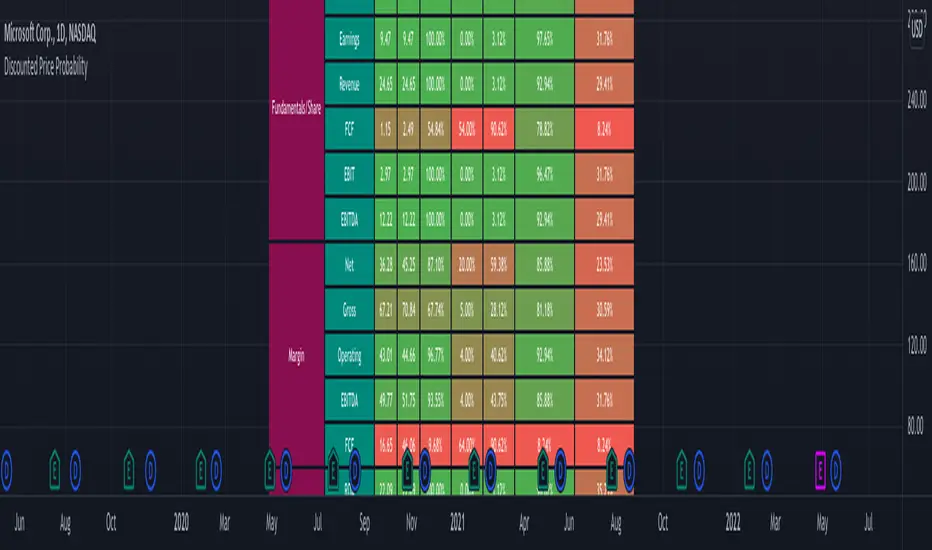
In short, the definitions of stats presented are as below
https://www.tradingview.com/x/JC4nmFZz/
🎲 Settings
Settings are pretty straightforward
https://www.tradingview.com/x/TEop7fvG/
🎲 How to look at these stats
To Start with
If all the above are greener, then it means, company is in strong growth space.
Example: TSLA
https://www.tradingview.com/x/GRuSxA9R/
Even though the financial ratios of TSLA are not in par with most of the fundamentally strong stocks, it is indeed growing steadily and at its near all time high.
Lets take another example of NKLA
https://www.tradingview.com/x/up8WTxpx/
Here the base columns regarding fundamentals are mostly red. This means, company has suffered setback with respect to their financials and the company is not where it used to be. But, if you see the differential probabilities, it says 92% of being undervalued?
Well, this is due to the fact that NKLA's fundamentals suffered most of the time and they are always below par when compared to price. Hence, such kind of cases may interpret the stocks as undervalued. Hence, even if the probability of being undervalued is more, it does not guarantee the quality of the stock. We need to be mindful overall financials of the company and how they fare with general standards.
Moving forward
Some examples of high flyers:
https://www.tradingview.com/x/NwWzyKc1/
Some for deep pullbacks:
https://www.tradingview.com/x/qjBW85XU/
And the meme stocks:
https://www.tradingview.com/x/edrTXCdO/
Script makes use of the library written on matrix matrix
🎲 Process
Probability is measured in two angles
🎯 Absolute : Measure the percentile of price and fundamentals with respect to all time high. The difference between the two is measure of probability of stock being undervalued.
🎯 Drawdown : Measure the percentile of distance from all time high for both price and fundamentals. The difference between the two is used for depicting the probability of stock being undervalued.
🎲 Components
In short, the definitions of stats presented are as below
https://www.tradingview.com/x/JC4nmFZz/
🎲 Settings
Settings are pretty straightforward
https://www.tradingview.com/x/TEop7fvG/
🎲 How to look at these stats
To Start with
- Are most of the fundamental values coloured in green? If yes, it means that they are near all time high in terms of percentile.
- If drawdowns of fundamental values coloured in green? If yes, it means, the stock has not suffered much drawdowns of fundamentals from its peak.
- Are the percentile values of drawdowns in green? If yes, it means, that drop in fundamentals are not high compared to its previous values.
If all the above are greener, then it means, company is in strong growth space.
Example: TSLA
https://www.tradingview.com/x/GRuSxA9R/
Even though the financial ratios of TSLA are not in par with most of the fundamentally strong stocks, it is indeed growing steadily and at its near all time high.
Lets take another example of NKLA
https://www.tradingview.com/x/up8WTxpx/
Here the base columns regarding fundamentals are mostly red. This means, company has suffered setback with respect to their financials and the company is not where it used to be. But, if you see the differential probabilities, it says 92% of being undervalued?
Well, this is due to the fact that NKLA's fundamentals suffered most of the time and they are always below par when compared to price. Hence, such kind of cases may interpret the stocks as undervalued. Hence, even if the probability of being undervalued is more, it does not guarantee the quality of the stock. We need to be mindful overall financials of the company and how they fare with general standards.
Moving forward
- To understand value of trending stock, use Absolute Probability (marked with P). Ex. GOOG, MSFT, BRK.B etc.
- To understand value of stock which has been recently suffered huge price drop, look at drawdown based probability (marked with D). Ex. BABA, FB, PYPL, SQ, ROKU etc.
Some examples of high flyers:
https://www.tradingview.com/x/NwWzyKc1/
Some for deep pullbacks:
https://www.tradingview.com/x/qjBW85XU/
And the meme stocks:
https://www.tradingview.com/x/edrTXCdO/
發行說明
Changes to getPercentileDrawdown function using yet another new pine method of binary search. Functionally, this does not change anything. But, improves the code performance.Thanks to lejmer for suggesting this improvement :)
開源腳本
秉持TradingView一貫精神,這個腳本的創作者將其設為開源,以便交易者檢視並驗證其功能。向作者致敬!您可以免費使用此腳本,但請注意,重新發佈代碼需遵守我們的社群規範。
Trial - trendoscope.io/trial
Subscribe - trendoscope.io/pricing
Blog - docs.trendoscope.io
Subscribe - trendoscope.io/pricing
Blog - docs.trendoscope.io
免責聲明
這些資訊和出版物並非旨在提供,也不構成TradingView提供或認可的任何形式的財務、投資、交易或其他類型的建議或推薦。請閱讀使用條款以了解更多資訊。