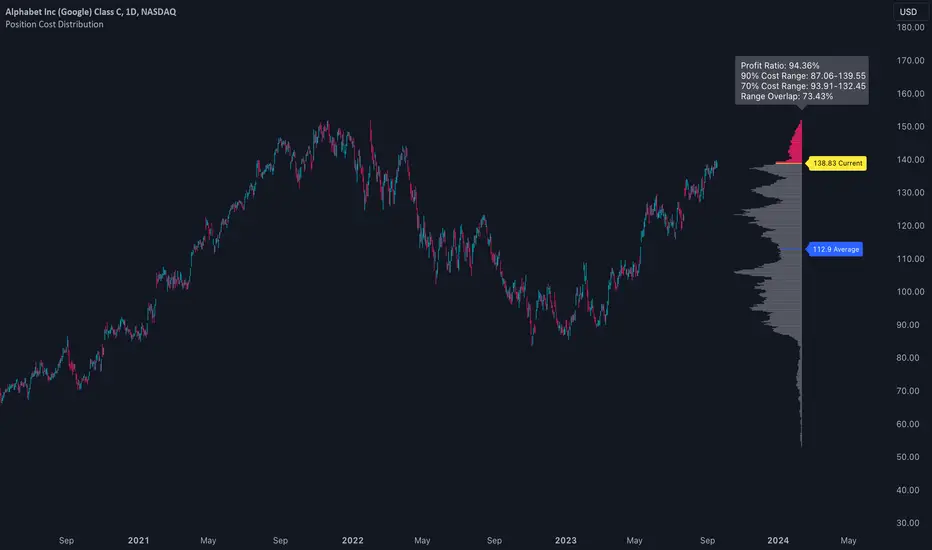
The Position Cost Distribution indicator (also known as the Market Position Overview, Chip Distribution, or CYQ Algorithm) provides an estimate of how shares are distributed across different price levels. Visually, it resembles the Volume Profile indicator, though they rely on distinct computational approaches.
🟠 Principle
The Position Cost Distribution algorithm is based on the principle that a security's total shares outstanding usually remains constant, except under conditions like stock splits, reverse splits, or new share issuance. It views all trading activity as simply exchanging share positions between holders at different price points.
By analyzing daily trade volume and the prior day's distribution, the algorithm infers the resulting share distribution after each day. By tracking these inferred transpositions over time, the indicator builds up an aggregate view of the estimated share concentration at each price level. This provides insights into potential buying and selling pressure zones that could form support or resistance areas.
Together with the Volume Profile, the Position Cost Distribution gives traders multiple lenses for examining market structure from both a volume and positional standpoint. Both can help identify meaningful technical price levels.
🟠 Algorithm
The algorithm initializes by allocating all shares to the price range encompassed by the first bar displayed on the chart. Preferably, the chart window should include the stock's IPO date, allowing the model to distribute shares specifically to the IPO price.
For subsequent trading sessions, the indicator performs the following calculations:
1. The daily turnover ratio is calculated by dividing the bar's trading volume by total outstanding shares.
2. For each price level (bucket), the number of shares is reduced by the turnover amount to represent shares transferring from existing holders.
3. The bar's total volume is then added to buckets corresponding to that period's price range.
Currently, the model assumes each share has an equal probability of being exchanged, regardless of how long ago it was acquired or at what price. Potential optimizations could incorporate factors like making shares held longer face a smaller chance of transfer compared to more recently purchased shares.
────────────────────────────────────────────
中文介绍:该指标为“筹码分布”的一个 TradingView 实现 :)
開源腳本
秉持TradingView一貫精神,這個腳本的創作者將其設為開源,以便交易者檢視並驗證其功能。向作者致敬!您可以免費使用此腳本,但請注意,重新發佈代碼需遵守我們的社群規範。
专业缠论指标: alphaviz.pro/chanlun
Email: contact@alphaviz.pro
Discord: discord.gg/w2fFtNega4
Email: contact@alphaviz.pro
Discord: discord.gg/w2fFtNega4
免責聲明
這些資訊和出版物並非旨在提供,也不構成TradingView提供或認可的任何形式的財務、投資、交易或其他類型的建議或推薦。請閱讀使用條款以了解更多資訊。