OPEN-SOURCE SCRIPT
Background Up or Down
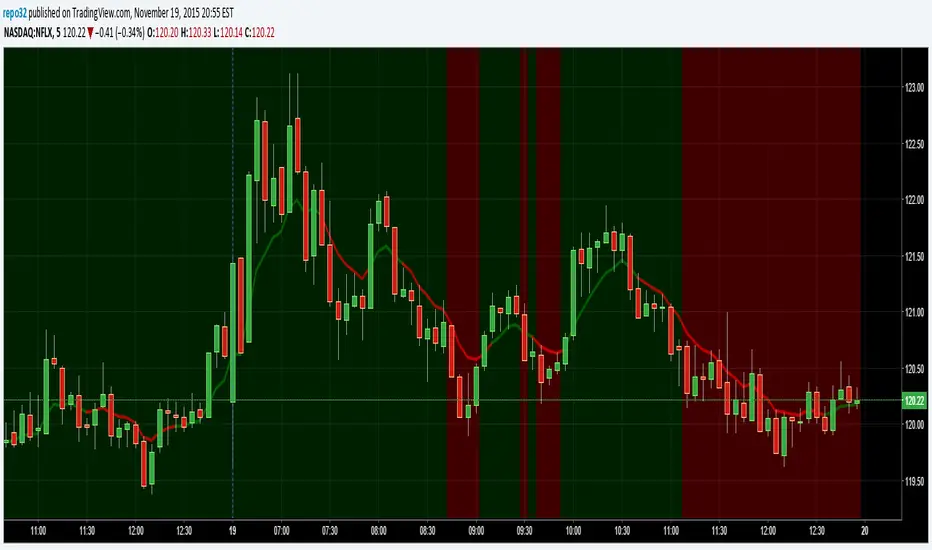
This script will color the background based upon whether it is positive or negative for the day. When looking at numerous charts, you can instantly see if they are up or down for the day. For me, I like to be going long on the stocks that are already moving up and short on the ones that are moving down. When using lower time frames, you can lose perspective of where it is on the daily chart.
On the example above, you can see a 5 minute chart of NFLX. It shows you when it dropped below the previous days close.
On the example above, you can see a 5 minute chart of NFLX. It shows you when it dropped below the previous days close.
開源腳本
秉持TradingView一貫精神,這個腳本的創作者將其設為開源,以便交易者檢視並驗證其功能。向作者致敬!您可以免費使用此腳本,但請注意,重新發佈代碼需遵守我們的社群規範。
免責聲明
這些資訊和出版物並非旨在提供,也不構成TradingView提供或認可的任何形式的財務、投資、交易或其他類型的建議或推薦。請閱讀使用條款以了解更多資訊。
免責聲明
這些資訊和出版物並非旨在提供,也不構成TradingView提供或認可的任何形式的財務、投資、交易或其他類型的建議或推薦。請閱讀使用條款以了解更多資訊。