Haven Average Daily RangeOverview
This indicator is an enhanced version of the traditional ADR tool that adapts to intraday price movements. Unlike static ADR levels, this indicator dynamically adjusts its range boundaries based on real-time price action while maintaining the original ADR calculation framework.
Key Features
ADR calculation based on multiple periods (5, 10, and 20 days)
ADR levels displayed with automatic style changes upon range reach
Customizable display settings (color, line style)
Price labels for better visualization
The indicator helps traders assess the instrument's volatility, identify potential reversal zones, and plan daily trading targets.
Suitable for all timeframes up to D1 and any trading instrument.
How It Works
Session Start (UTC+0): Calculates ADR based on historical data and sets initial High/Low levels
Dynamic Phase: Monitors price action and adjusts the opposite boundary (ADR Low or High) when new extremes are reached.
When price creates new Day high price above the opening price, the ADR Low level moves upward proportionally.
When price creates new Day low price below the opening price, the ADR High level moves downward proportionally.
Completion Phase: Stops adjustments and highlights breach when price reaches either boundary
Trading Application
Entry and Exit Signals
The ADR boundaries serve as key decision points for trade execution. When price approaches the upper ADR boundary, it often signals a potential selling zone, particularly when confluence exists with other overbought indicators such as RSI divergence or resistance levels. Conversely, price reaching the lower ADR boundary frequently indicates potential buying opportunities, especially when supported by oversold conditions or support confluences.
Trend Continuation Assessment
One of the most valuable applications is gauging the probability of continued directional movement. When the current session's price action has not yet reached either ADR boundary, statistical probability favors trend continuation in the established direction. This information helps traders stay with profitable positions longer rather than exiting prematurely.
Reversal and Consolidation Zones
The visual color change to orange when ADR boundaries are reached provides immediate feedback that the normal daily range has been exhausted. At this point, the probability of trend reversal or sideways consolidation increases significantly. This signal helps traders prepare for potential position adjustments or new counter-trend opportunities.
每日圖表

Daily Price RangeThe indicator is designed to analyze an instrument’s volatility based on daily extremes (High-Low) and to compare the current day’s range with the typical (median) range over a selected period. This helps traders assess how much of the "usual" daily movement has already occurred and how much may still be possible during the trading day.

VWAP Balance Zones - SessionsVWAP Balance Zones Sessions Version is an alternate take on the Original VWAP Balance Zones indicator. The Sessions version allows users to select a specific session to view the VWAP Balance Zones at while still utilizing the full ETH Data.
The Session version provides a better focused display while still maintaining the core functions of the original script with mindful optimizations.
Author's Note: "VBZ Sessions was made with logistics in mind, for the users who only trade within certain times of the day. While it displays the same core concepts, it is not as "Raw" of a display as the Original. For this reason, some users may prefer the Original VWAP Balance Zones, which is why I have opted to release this alternate version instead of updating the original."
> What are VWAP Balance Zones?
"VWAP Balance Zones" is an original concept aimed at identifying the equilibrium area between market participants within the current trend by averaging the Daily Extremes and the Daily VWAP.
Refer to the illustration below for a better understanding of exactly how VWAP Balance Zones are formed:
These zones are displayed for the Daily, Weekly, and Monthly VWAPs, with the most interactive timeframe being the Daily.
> Features
1. The Session Version uses ETH data at all times, and does not solely rely on the chart's data to create the VWAPs or Zones.
This allows the user to focus on a specific trading session, while not losing out on the full VBZ Calculation, with the notable benefit of a cleaner display.
The Original VBZ starts drawing at the beginning of the chart's "Day", and would produce different results when using an RTH chart vs an ETH chart. Along with creating a bird's nest of unusable data at the beginning of the day.
2. Session Start and End lines are displayed for easier identification of the designated trading session.
3. The extreme "Close" Lines are no longer displayed to reduce noise and redundancy.
4. Additionally, the interior VWAP lines are no longer displayed. Ultimately, this was to reduce noise and focus the script on the 50% zones.
5. Weekly and Monthly Zones are now displayed due to the reduced noise!
6. As with the original, the weekly display will yield to the daily, and the monthly display will yield to the weekly.
In the screenshot below, you can observe this behavior.
Enjoy!

D|W|M|Y Breaks with NY TimezoneThis indicator plots breaks for multiple timeframes: Daily, Weekly, Monthly, Quarterly, Half Yearly, Yearly.
I also added the option to change timezone to New York to see the week the ICT way ;)

Even vs Odd Days Performance█ OVERVIEW
The Even vs Odd Days Performance indicator is designed to visualise and compare the performance of even-numbered days versus odd-numbered days. This indicator explores one of the many calendar based anomalies that exist in financial markets.
In the context of financial analysis, a calendar based anomaly refers to patterns or tendencies that are linked to specific time periods, such as days of the week, weeks of the month, or months of the year. This indicator helps explore whether such a calendar based anomaly exists between even and odd days.
By calculating cumulative daily performance and counting the number of days with positive returns, it provides a clear snapshot of whether one set of days tends to outperform the other, potentially highlighting a calendar based anomaly if a significant difference is observed.
█ FEATURES
Customisable time window through input settings.
Tracks cumulative returns for even and odd days separately.
Easily adjust table settings like position and font size via input options.
Clear visual distinction between even and odd day performance using different colours.
Built-in error checks to ensure the indicator is applied to the correct timeframe.
█ HOW TO USE
Add the indicator to a chart with a Daily timeframe.
Choose your start and end dates in the Time Settings.
Enable or disable the performance table in the Table Settings as needed.
View the cumulative performance, with even days in green and odd days in red.

Daily/Weekly/Monthly LevelsDaily/Weekly/Monthly Levels
TLDR
Shows Daily/Weekly/Monthly reversal levels. These can act as support/resistance levels.
Can only see what's in your candle history. I.e. It won't see old monthlies on your 1m chart! Use Daily to see everything with the most history.
Can only see levels higher than or equal to your current time frame. I.e. it will not see daily levels if you're looking at a weekly chart.
Doesn't keep levels that have been closed through. Does keep levels that have been only wicked.
This indicator shows you daily, weekly and monthly horizontal reversal levels to save you the hassle of doing it yourself. It's a little aid to speed up your TA routine.
Usage Details and Limitations
All daily, weekly, and monthly levels will be marked with lines on the chart automatically. Levels will only be visible from that level's TF or lower, i.e. you can't see the daily levels from the weekly chart, but you can see all levels from daily or lower charts. No levels will be displayed if you select a time frame higher than 1 month.
New levels will not be drawn if they are very close to existing levels. You can change the 'closeness' threshold in settings. It is specified as a percentage move from the existing level.
However, higher TF levels will REPLACE lower TF levels if they are too close. If you set the 'closeness' setting to 0, all levels will be drawn.
Levels will only be drawn if they are in your displayed candle range! I.e. the lower you go in timeframe, the less history you can see, and so levels originating from further back might be missed!
One technique you might have is to load up the daily timeframe and use that to mark any nearby levels of interest.
How does it work?
Basically, it looks for reversal candles on the D/W/M Timeframes, and draws a line for you from the open of the reversal candle (of that TF), so long as you are on a TF equal or lower than that level.
New bars on that TF that close through that TF's old levels will clear that level. Wicks do not clear.
Each newly found level will not be drawn if it's within the percentage distance of an existing level of equal or higher time frame.
Each new level also checks for existing levels on lower TFs that it can replace. E.g. if a monthly bar closes and produces a monthly level equal to an existing daily or weekly level, that daily or weekly level will be replaced. Use the settings to specify your 'closeness' allowance.
Please remember, it can only see as far back as your candle history, so you won't see old monthlies on a 1 minute chart! Use the daily TF to see all three levels at once with maximum history.

ADR Table BY @ICT_YEROADR Table BY @ICT_YERO
Created by: @ICT_YERO
This custom indicator is designed to provide the Average Daily Range (ADR) for multiple timeframes, including Daily, 4-Hour, and 1-Hour. The indicator is tailored to assist traders in understanding price volatility and making informed trading decisions.
Key Features
Multi-Timeframe ADR Calculation:
Automatically calculates and displays the ADR for Daily, 4-Hour, and 1-Hour timeframes.
Helps traders identify potential price movement ranges for different trading sessions.
Dynamic Range Visualization:
Clear visual representation of the ADR on the chart, making it easy to spot price extremes.
Real-time updates to reflect changes in price movement.
Custom Alerts:
Option to set alerts when the price approaches the ADR high or low.
Useful for identifying potential reversal zones or breakout opportunities.
User-Friendly Interface:
Simple and intuitive settings to customize colors, levels, and display preferences.
Seamlessly integrates with your existing TradingView setup.
ICT-Inspired Methodology:
Designed for traders who follow ICT concepts, focusing on precision and high-probability setups.
Applications
Range Trading: Helps determine the high and low boundaries for scalping or intraday setups.
Volatility Analysis: Understand market behavior during different times of the day or week.
Reversal Zones: Identify areas where price is likely to reverse, based on ADR extremes.
Whether you're a scalper, day trader, or swing trader, this indicator provides a comprehensive overview of price volatility across multiple timeframes, making it an essential tool for your trading arsenal.

Multi-Timeframe Liquidity LevelsMulti-Timeframe Liquidity Levels – Overview
The Multi-Timeframe Liquidity Levels indicator automatically displays significant highs and lows from various timeframes (Daily, Weekly, Monthly, and Quarterly) on your current chart. This allows traders to quickly identify potential support and resistance zones without frequently switching between different timeframe charts. Additionally, the script offers extra lines for special reference points (e.g., the “Midnight” midpoint of the current day and the previous day’s open/close) to highlight potential liquidity zones even more clearly.
1. Core Idea and Benefits
Time-Saving: Instead of manually reviewing charts in different timeframes, the indicator fetches relevant high/low levels automatically and shows them on your active timeframe.
Clear Layout: Traders instantly see where the Daily, Weekly, Monthly, and Quarterly highs and lows lie—areas often associated with institutional orders or liquidity hunts.
Customizable: You can tailor the color scheme, line style (Solid, Dashed, Dotted), and line width, ensuring the displayed levels fit your personal charting style.
2. How It Works
Multi-Timeframe High/Low
For each timeframe (Day, Week, Month, Quarter), the indicator references the previous candle’s high and low (high , low ).
Using request.security(...), these values are plotted on the chart you’re currently viewing.
Flexible Display
You can individually enable or disable the Daily, Weekly, Monthly, and Quarterly lines, depending on which levels are most relevant to your trading.
With Line Style (Solid, Dashed, Dotted) and Line Width, you can easily emphasize certain lines you consider more important.
Additional Lines
“Midnight” Line: A theoretical midpoint between today’s high and low, which can be useful for gauging daily pivot areas.
Previous Day’s Open/Close: Many traders track these reference points to anticipate market reactions. You can show or hide these lines as desired.
Automatic Line Removal & Creation
When a particular timeframe (e.g., “Show Monthly Levels”) is disabled, the script automatically removes the existing monthly lines.
Enabling it again recreates those lines without hassle.
3. Usage and Interpretation
Identifying Support and Resistance
Highs and lows from higher timeframes are often key zones for entries, exits, or major market reactions.
A Daily level may be crucial for short-term traders, whereas Monthly or Quarterly levels can indicate long-term liquidity areas.
Spotting Market Shifts
If price decisively moves above a Higher-Timeframe line, it could signal strong momentum.
Conversely, a failed breakout (where price quickly returns under or above a level) might warn of a potential reversal.
Extra Lines as Filters
The “Midnight” Line helps visualize a rough central price for the current day, aiding in intraday directional bias.
Previous Day’s Open/Close: Common reference points for day traders, where swift approaches and rejections can indicate potential entries or partial take-profit zones.
4. Practical Tips
Use Color-Coding Wisely: Assign distinct colors (e.g., Blue for Daily, Green for Weekly, Orange for Monthly, Purple for Quarterly) so you can easily discern which timeframe you’re looking at.
Toggle On/Off As Needed: Day traders might focus on Daily and Weekly, while long-term traders may pay closer attention to Monthly and Quarterly.
Combine with Price Action: Lines alone don’t constitute a trading strategy. Use them alongside candlestick patterns, volume analysis, or other indicators for a more complete market perspective.
5. Important Notes & Recommendations
Not Financial Advice: This indicator simply reflects historical high/low data across multiple timeframes and does not constitute a buy or sell recommendation.
Trader Responsibility: Observe how the market actually behaves around these lines and adapt your risk management accordingly.

Roman's Ranges(GOLD FUTURES)This indicator provides the user with Gold Future's previous day’s range and how long it took for the price to reach its first extreme for the day. This information is used to predict the most probable daily direction trend and estimate how long you should expect to hold your winning trade. The distance and time are based on the market open candle (6:30 am). It measures from the retracement wick of the candle to the last 5m close of the day’s first extreme low or high point. It also includes that distance in pts.
Previous market data does not guarantee future results, however, you can leverage the knowledge of the previous day’s ranges to set reasonable take profit levels and when your target is not met automatically, you know how long it took on the previous day to reach the day’s first low/high. If you are nearing that amount of time and your trade is not as profitable as expected, it is easier to get out with less profits using this estimated time rather than hoping the market closes in your favor.
Markets go through cycles and it can be difficult to trade them all if you have a fault expectation how how far the price is expected to move. Price tends to deviate slowly from the average ranges slightly day after day, but you can expect an average range to prevail throughout the week +/- 3 points. It can be very easy to be stuck on 5-point take-profit levels that you don’t pay attention to the average range being twice or three times that distance. The same can be said for the opposite scenario with having higher profit expectations than reasonably possible.
This indicator and my statements are not financial advice. This is meant for educational purposes only.

Market Pivot Levels [Past & Live]Market Levels provide a robust view of daily pivot points of markets such as high/low/close with both past and live values shown at the same time using the recently updated system of polylines of pinescript.
The main need for this script arose from not being able to use plots for daily points because plots are inherently once drawn can't be erased and because we can't plot stuff for previous bars after values are determined we can't use them reliably. And while we can use traditional lines, because we would have extremely high amount of lines and we would have to keep removing the previous ones it wouldn't be that effective way for us. So we try to do it with the new method of polylines .
Features of this script:
- Daily High/Low Points
- Yesterday High/Low/Close Points
- Pre-Market High-Low points.
Now let's preview some of the important points of code and see how we achieve this:
With the code below we make sure no matter which chart we are using we are getting the extended hours version of sessions so our calculations are made safely for viewing pre-market conditions.
// Let's get ticker extended no matter what the current chart is
tc = ticker.new(syminfo.prefix, syminfo.ticker, session.extended)
Coding our own function to calculate high's and low's because inbuilt pinescript function cannot take series and we send this function to retrieve our high's and lows.
// On the fly function to calculate daily highlows instead of tv inbuilt because tv's length cannot take series
f_highlow(int last) =>
bardiff = last
float _low = low, float _high = high
for i = bardiff to 0 by 1
if high > _high
_high := high
if low < _low
_low := low
With doing calculations at the bars of day ending points we can retrieve the correct points and values and push them for our polylines array so it can be used in best way possible.
// Daily change points
changeD = timeframe.change("D")
// When new day starts fill polyline arrays with previous day values for polylines to draw on chart
// We also update prevtime values with current ones after we pushed to the arrays
if changeD
f_arrFill(cpArrHigh, cpArrLow, prevArrh, prevArrl, prevArrc, prevMarh, prevMarl)
valHolder.unshift(valueHold.new(_high, _low, _high, _close, _low, time, pr_h, pr_l))
The rest of the code is annotated and commented. You can let me know in comments if you have any questions. Happy trading.

Scoopy StacksWaffle Around Multiple
(Open, High, Low, Close) Stacks On
Pre/Post Market & (Daily, Weekly,
Monthly, Yearly) Sessions With
Meticulous Columns, Rows, Tooltips,
Colors, Custom Ideas, and Alerts.
Sessions Use Two Step Incremental Values
Default Value: (1) Shows Two Previous
(O, H, L, C); Increasing Value Swaps
Sessions With Next Two Stacks.
⬛️ KEY WORDS:
🟢 Crossover | 🔴 Crossunder
📗 High | 📕 Low
📔 Open | 📓 Close
🥇 First Idea | 🥈 Second Idea
🥉 Third Idea | 🎖️ Fourth Idea
🟥 ALERTS:
Default Option: (Per Bar)
Alerts Once Conditions Are Met
(Bar Close) Alerts When Bar Closes
Default Option: (Reg)
Alerts During Regular Market
Trading Hours, (0930-1600)
(Ext) Alerts During Extended
Market Hours, (1600-0930)
(24/7) Alerts All Day
Optional Preferences:
Regular Alerts - Stocks
Extended Alerts - Futures
24/7 Alerts - Crypto
🟧 STACKS:
Default Value: (1)
Incremental Stack Value, Increasing Value
Swaps Sessions With the Next Two Stacks
(✓) Swap Stacks?
Pre/Post Market High/Lows,
1-2 Day High/Lows, 1-2 Week High/Lows,
1-2 Month High/Lows, 1-2 Year High/Lows
( ) Swap Stacks?
Pre/Post Market Open/Close,
1-2 Day Open/Close, 1-2 Week Open/Close,
1-2 Month Open/Close, 1-2 Year Open/Close
🟨 EXAMPLES:
Default Stack:
🟢 | 📗 Pre Market High (PRE) | 4600.00
🔴 | 📕 Post Market Low (POST) | 420.00
Optional: (Open)
🟢 | 📔 Post Market Open (POST) | 4400.00
Optional: (Close)
🔴 | 📓 Pre Market Close (PRE) | 430.00
Default Stack Value: (1)
🔴 | 📗 1 Day High (1DH) | 460.00
Next Stack Value: (3)
🟢 | 📕 4 Day Low (4DL) | 420.00
Optional: (Open)
🔴 | 📔 2 Day Open (2DO) | 440.00
Optional: (Close)
🟢 | 📓 3 Day Close (3DC) | 430.00
Default Stack Value: (5)
🟢 | 📗 5 Week High (5WH) | 460.00
Next Stack Value: (7)
🔴 | 📕 8 Week Low (8WL) | 420.00
Optional: (Open)
🔴 | 📔 7 Week Open (7WO) | 4400.00
Optional: (Close)
🟢 | 📓 6 Week Close (6WC) | 430.00
Default Stack Value: (9)
🔴 | 📗 9 Month High (9MH) | 460.00
Next Stack Value: (11)
🟢 | 📕 12 Month Low (12ML) | 420.00
Optional: (Open)
🟢 | 📔 11 Month Open (11MO) | 4400.00
Optional: (Close)
🔴 | 📓 10 Month Close (10MC) | 430.00
Default Stack Value: (13)
🟢 | 📗 13 Year High (13YH) | 460.00
Next Stack Value: (15)
🟢 | 📕 16 Year Low (16YL) | 420.00
Optional: (Open)
🔴 | 📔 15 Year Open (15YO) | 4400.00
Optional: (Close)
🔴 | 📓 14 Year Close (14YC) | 430.00
🟩 TABLES:
Default Value: (1)
Moves Table Up, Down, Left, or Right
Based on Second Default Value
First Default Value: (Top Right)
Sets Table Placement, Middle Center
Allows Table To Move In All Directions
Second Default Value: (Default)
Fixed Table Position, Switching Values
Moves Direction of the Table
🟦 IDEAS:
(✓) Show Ideas?
Shows Four Ideas With Custom Texts
and Values; Ideas Are Based Around
Post-It Note Reminders with Alerts
Suggestions For Text Ideas:
Take Profit, Stop Loss, Trim, Hold,
Long, Short, Bounce Spot, Retest,
Chop, Support, Resistance, Buy, Sell
🟪 EXAMPLES:
Default Value: (5)
Shows the Custom Table Value For
Sorted Table Positions and Alerts
Default Text: (🥇)
Shown On First Table Cell and
Message Appearing On Alerts
Alert Shows: 🟢 | 🥇 | 5.00
Default Value: (10)
Shows the Custom Table Value For
Sorted Table Positions and Alerts
Default Text: (🥈)
Shown On Second Table Cell and
Message Appearing On Alerts
Alert Shows: 🔴 | 🥈 | 10.00
Default Value: (50)
Shows the Custom Table Value For
Sorted Table Positions and Alerts
Default Text: (🥉)
Shown On Third Table Cell and
Message Appearing On Alerts
Alert Shows: 🟢 | 🥉 | 50.00
Default Value: (100)
Shows the Custom Table Value For
Sorted Table Positions and Alerts
Default Text: (🎖️)
Shown On Fourth Table Cell and
Message Appearing On Alerts
Alert Shows: 🔴 | 🎖️ | 100.00
⬛️ REFERENCES:
Pre-market Highs & Lows on regular
trading hours (RTH) chart
By Twingall
Previous Day Week Highs & Lows
By Sbtnc
Screener for 40+ instruments
By QuantNomad
Daily Weekly Monthly Yearly Opens
By Meliksah55

Ribbit RangesBounce Around Multiple
(Open, High, Low, Close) Ranges
On Pre/Post Market & (Daily, Weekly,
Monthly, Yearly) Sessions With
Meticulous Lines, Labels, Tooltips,
Colors, Custom Ideas, and Alerts.
Sessions Use Two Step Incremental Values
Default Value: (1) Shows Two Previous
(O, H, L, C); Increasing Value Swaps
Sessions With Next Two Ranges.
⬛️ KEY WORDS:
🟢 Crossover | 🔴 Crossunder
📗 High | 📕 Low
📔 Open | 📓 Close
🥇 First Idea | 🥈 Second Idea
🥉 Third Idea | 🎖️ Fourth Idea
🟥 ALERTS:
Default Option: (Per Bar)
Alerts Once Conditions Are Met
(Bar Close) Alerts When Bar Closes
Default Option: (Reg)
Alerts During Regular Market
Trading Hours, (0930-1600)
(Ext) Alerts During Extended
Market Hours, (1600-0930)
(24/7) Alerts All Day
Optional Preferences:
Regular Alerts - Stocks
Extended Alerts - Futures
24/7 Alerts - Crypto
🟧 RANGES:
Default Value: (1)
Incremental Range Value, Increasing Value
Swaps Sessions With the Next Two Ranges
(✓) Swap Ranges?
Pre/Post Market High/Lows,
1-2 Day High/Lows, 1-2 Week High/Lows,
1-2 Month High/Lows, 1-2 Year High/Lows
( ) Swap Ranges?
Pre/Post Market Open/Close,
1-2 Day Open/Close, 1-2 Week Open/Close,
1-2 Month Open/Close, 1-2 Year Open/Close
🟨 EXAMPLES:
Default Range:
🟢 | 📗 Pre Market High (PRE) | 4600.00
🔴 | 📕 Post Market Low (POST) | 420.00
Optional: (Open)
🟢 | 📔 Post Market Open (POST) | 4400.00
Optional: (Close)
🔴 | 📓 Pre Market Close (PRE) | 430.00
Default Range Value: (1)
🔴 | 📗 1 Day High (1DH) | 460.00
Next Range Value: (3)
🟢 | 📕 4 Day Low (4DL) | 420.00
Optional: (Open)
🔴 | 📔 2 Day Open (2DO) | 440.00
Optional: (Close)
🟢 | 📓 3 Day Close (3DC) | 430.00
Default Range Value: (5)
🟢 | 📗 5 Week High (5WH) | 460.00
Next Range Value: (7)
🔴 | 📕 8 Week Low (8WL) | 420.00
Optional: (Open)
🔴 | 📔 7 Week Open (7WO) | 4400.00
Optional: (Close)
🟢 | 📓 6 Week Close (6WC) | 430.00
Default Range Value: (9)
🔴 | 📗 9 Month High (9MH) | 460.00
Next Range Value: (11)
🟢 | 📕 12 Month Low (12ML) | 420.00
Optional: (Open)
🟢 | 📔 11 Month Open (11MO) | 4400.00
Optional: (Close)
🔴 | 📓 10 Month Close (10MC) | 430.00
Default Range Value: (13)
🟢 | 📗 13 Year High (13YH) | 460.00
Next Range Value: (15)
🟢 | 📕 16 Year Low (16YL) | 420.00
Optional: (Open)
🔴 | 📔 15 Year Open (15YO) | 4400.00
Optional: (Close)
🔴 | 📓 14 Year Close (14YC) | 430.00
🟩 COLORS:
(✓) Swap Colors?
Text Color Is Shown Using
Background Color
( ) Swap Colors?
Background Color Is Shown
Using Text Color
🟦 IDEAS:
(✓) Show Ideas?
Plots Four Ideas With Custom Lines
and Labels; Ideas Are Based Around
Post-It Note Reminders with Alerts
Suggestions For Text Ideas:
Take Profit, Stop Loss, Trim, Hold,
Long, Short, Bounce Spot, Retest,
Chop, Support, Resistance, Buy, Sell
🟪 EXAMPLES:
Default Value: (5)
Shows the Custom Value For
Lines, Labels, and Alerts
Default Text: (🥇)
Shown On First Label and
Message Appearing On Alerts
Alert Shows: 🟢 | 🥇 | 5.00
Default Value: (10)
Shows the Custom Value For
Lines, Labels, and Alerts
Default Text: (🥈)
Shown On Second Label and
Message Appearing On Alerts
Alert Shows: 🔴 | 🥈 | 10.00
Default Value: (50)
Shows the Custom Value For
Lines, Labels, and Alerts
Default Text: (🥉)
Shown On Third Label and
Message Appearing On Alerts
Alert Shows: 🟢 | 🥉 | 50.00
Default Value: (100)
Shows the Custom Value For
Lines, Labels, and Alerts
Default Text: (🎖️)
Shown On Fourth Label and
Message Appearing On Alerts
Alert Shows: 🔴 | 🎖️ | 100.00
⬛️ REFERENCES:
Pre-market Highs & Lows on regular
trading hours (RTH) chart
By Twingall
Previous Day Week Highs & Lows
By Sbtnc
Screener for 40+ instruments
By QuantNomad
Daily Weekly Monthly Yearly Opens
By Meliksah55

VWAP Balance ZonesVWAP Balance Zones (VBZ) Is based on 3 concepts.
Many Traders use VWAP to help determine Price Trends.
Trends are typically identified by new Highs or new Lows.
Balanced is found when Supply and Demand are mostly Equal.
VBZ tracks the daily, weekly, and monthly highs and lows; Then plots the average (50%) between the VWAP and the respective extremes.
50% VWAP Zones can be considered significant since they attempt to identify the equilibrium between market participants within the current trend, serving as key reference points to consider for decision making. >While in an uptrend, Buyers may see price falling to the Hi 50% as an attractive value entry for the continuation upwards.
>While ALSO in an uptrend, Sellers may see price falling to the Hi 50% as a change in sentiment with more downwards movement on the way.
Because of these conflicting mindsets, these zones are thought to display areas of balance between buyers and sellers, which can serve as potential decision points throughout the day.
VBZ Draws Zones from the Daily (High/Low/Close) VWAPs and the Day's (High/Low/Close) extremes as seen below.
Technically speaking, an average between vwap and extreme is a single point, to make these into zones I am using multiple sources for vwap and tracking different points of the bar throughout the day (ex. Close VWAP & Daily Highest Close)
Weekly and Monthly are only displaying the Average Price between the VWAP and the (Weekly or Monthly) High/Low.
These hold up as important levels for speculation; however, since most action will be discovered at the daily zones, I am not displaying the zones for the Weekly and Monthly to keep noise to a minimum.
Unique Behaviors:
- Weekly values are hidden on the first day of the week since they are similar to the daily values on the first day of the week.
- Monthly values are hidden in the first week of the month for the same reason.

[TTI] Price confirmation indicator📜 ––––HISTORY & CREDITS––––
The Price Confirmation Indicator is an innovative tool developed by TintinTrading to help his students learn to interpret Price + Volume moves. It is designed to provide traders with a visual cue for price movement confirmation based on both price direction and trading volume. I got the idea from watching Daivd Ryan, how he explains that he looks at volume first before looking at the price of a stock.
🦄 –––UNIQUENESS–––
What sets this indicator apart is its dual analysis approach and easy interpretation: it not only evaluates price movements but also takes trading volume into account. The indicator's color-coded bars are dynamically adjusted based on the volume difference from a 50-day Simple Moving Average (SMA) of the volume. This offers traders an intuitive way to gauge both the market's direction and its strength.
🛠️ ––––WHAT IT DOES––––
The Price Confirmation Indicator performs the following functions:
👉Price Movement: Determines whether each trading day is an 'Up Day' or a 'Down Day' based on the closing price.
👉Volume Analysis: Calculates the 50-day SMA of trading volume and identifies the volume difference in percentage terms.
👉Transparency Adjustment: Dynamically adjusts the transparency of colored bars based on the volume difference.
👉Bar Coloring: Colors the bars blue for 'Up Days' and purple for 'Down Days', with the transparency indicating the strength of the volume.
Transparency Tresholds:
Full color (no transparency 0%) - Volume is greater than 40% compared to the 50DSMA Volume
Strong color (little transparency 20%) - Volume is between 20% and 40% greater than the 50DSMA Volume
Noticable color (moderate transparency 40%) - Volume is between 0% and 20% greater than the 50DSMA Volume
Negligable color (strong transparency 60%) - Volume is light and is less than 50DSMA Volume with less than 20% lower.
Weak color (very strong transparency 80%) - Volume is below 50DSMA, with between 40% and 20% lower.
Very weak color (max transparency 90%) - Volume is below 50DSMA, with between -40% and -80% lower.
Alarming weak color (color is orange) - Volume is noticably light - this generally signals velocity contraction before a breakout.
💡 ––––HOW TO USE IT––––
Installation: Search for " Price Confirmation Indicator" in TradingView’s indicator library and add it to your chart.
Settings:
Price Up Color: Customize the color for 'Up Days'.
Price Down Color: Customize the color for 'Down Days'.
Interpretation:
Blue bars signify 'Up Days', and their transparency indicates the strength of the volume.
Purple bars represent 'Down Days', with transparency again indicating volume strength.
Orange bars signify extremely low volume days.
Volume Transparency: The less transparent the bar, the stronger the volume, aiding in confirming the price direction.
The indicator is a great tool for newer traders to get in the habit of reading Price & Volume together!

[TTI] Closing Range Indicator📜 ––––HISTORY & CREDITS––––
This Pine Script Utility indicator, titled " Closing Range Indicator," is designed and developed by TintinTrading but inspired by the teaching of Investor's Business Daily (IBD) and William O'Neil. It aims to help traders identify the closing range of a given timeframe, either daily or weekly.
🦄 –––UNIQUENESS–––
The unique feature of this indicator lies in its ability to simulate a functionality of Closing Range calculation based on hovering of the mouse over the close. It employs a conditional display that allows the user to set the indicator as 'invisible' without removing it from the chart and hence provides a numerical closing range value when hovering over the indicator.
🛠️ ––––WHAT IT DOES––––
The Closing Range Indicator calculates the closing range of a trading bar in terms of percentages. It computes the difference between the closing price and the low price of the bar, and then divides it by the range of the bar.
A stock that closes on the high would display 100%
A stock that closes on the low would display 0%
Generally, the higher the percentage the more bullish the close but there are exceptions to this rule.
The indicator can operate on two timeframes:
Daily : Computes the closing range based on the daily high, low, and closing prices.
Weekly : Computes the closing range based on the weekly high, low, and closing prices. If you enable the weekly it will show the weekly close on all daily timeframes. Meaning that if the week Closing range is 54.15% on Friday, it will show the value 54.15% for all days prior to Friday from the same week.
The indicator places a label at the close of each bar, with the label's tooltip showing the calculated closing range percentage. I generally hide the label and just reference the tooltip calculation with a a hoover on top of the bar.
💡 ––––HOW TO USE IT––––
Installation: Add the indicator to your TradingView chart by searching for " Closing Range Indicator" in the indicator library.
Reorder: Reorder the indicator so that it sits as the first indicator (even above the price) on the Pane. This will make sure that you always trigger the tooltip functionality.
Go to Settings:
Timeframe: Choose between daily ('D') and weekly ('W') timeframes from the settings.
Visibility: Enable the 'Make Invisible' option if you want the indicator to be hidden.
Interpretation:
A higher percentage indicates that the closing price is closer to the high of the range, signaling bullish sentiment.
A lower percentage indicates bearish sentiment.
Tooltip: Hover over the label to view the closing range in percentage terms.

Globex, Extended, Daily, Weekly, Monthly, Yearly Range* Adds Right Side Only Price Line & Labels for Tracking without Extending Both Sides
* Tracks Current, Previous, and Two Previous Globex Sessions/ Futures:
* Tracks Current, Previous, and Two Previous Extended Session/ Stocks:
* Tracks Current, Previous, Two, & Three Previous Day Session/ Equities:
* Tracks Current, Last, Two, Three, Four, & Five Week Session/ Equities:
* Tracks Current, Last, Two, Three, Four, & Five Month Session/ Equities:
* Tracks Current, Last, Two, Three, Four, & Five Year Session/ Equities:
* Allows Custom Range on Globex, Extended, & Daily Sessions
* Allows Custom Range on Weekly, Monthly, & Yearly Sessions
* Lines & Labels Are Not Visible on Chart Scales
* Reversible Text & Background Color
* Lines Extend Accordingly with Range
* Labels show Price & Percent Change
* Background Colors should match Chart Color to avoid Overlapping Text & Labels
* Lines have Offset Extension
* Labels have Offset Extension
* Globex Session is only visible on Futures & if Current Timeframe is Intraday
* Extended Session is only visible on Stocks & if Current Timeframe is Intraday
* Daily, Weekly, Monthly, & Yearly Sessions are visible on All Symbols & All Timeframes
* Globex, Extended, & Regular use their Default Time Sessions but allow Customization
* For Back Testing Default Sessions, switch over on the Menu to Style and Turn On/Off their Background Color; Any Area on the Chart Without Background Color is Regular Session

Supply and Demand Daily [LuxAlgo]The Supply and Demand Daily indicator displays daily supply and demand areas on the user's chart. These areas are constructed using the market data within a previous daily interval.
This script makes use of the same logic as our previous Supply and Demand Visible Range indicator .
🔶 USAGE
The supply/demand areas & levels displayed by the indicator aim to provide potential support/resistance levels for users. Supply areas highlight where buyers are willing to exit the market and sell the asset, thus providing resistance and potentially causing prices to reverse or bounce back downwards, while demand areas highlights where buyers were willing to purchase the asset, thus providing support and potentially causing prices to reverse or bounce back upwards.
Historical areas allow the user to study the evolution of supply/demand from one day to another. Wider areas highlight prices avoiding reverting to this area, while thinner areas highlight prices returning more frequently to them.
Trends can be determined by looking at the price position relative to the previous day's supply/demand areas. Price breaking down from the demand zone is indicative of a downtrend, while price breaking above the supply zone is indicative of an uptrend.
Pullback/throwback scenarios can also be common using this indicator.
🔶 SETTINGS
Threshold %: Percentage of the total visible range volume used as a threshold to set supply/demand areas. Higher values return wider areas.
Resolution: Determines the number of bins used to find each area. Higher values will return more precise results.
Intra-bar TF: Timeframe used to obtain intra-bar data.
🔶 RELATED SCRIPTS

Daily Monday Weekly Monthly Quarterly Yearly High Low Mid This indicator can be useful for traders who are interested in analyzing price movements over different time periods. By displaying the daily, Monday, weekly, monthly, quarterly, and yearly high and low values along with their mid values on a chart, traders can get a better understanding of how prices have behaved over longer periods of time.
For example, a trader might use this information to identify trends or patterns in the market. They might look for occasions when the daily high and low values move outside of an established range or when the weekly or monthly mid values cross certain key levels. This could signal a potential change in the market trend that the trader could act upon.
Additionally, the code can help traders identify key support and resistance levels based on the high and low values of the candles. By plotting these values on a chart, traders can see where prices tend to find support or resistance over different time periods. This information can be used to place stop loss orders or take profit orders at important levels.
Overall, the benefit of using the code you provided is that it offers traders a comprehensive view of price movements over different time periods, which can aid in making more informed trading decisions.
Each level described above has its own unique label, which is abbreviated for convenience. These abbreviations are listed below for quick reference:
For daily levels: DH (Daily High), DM (Daily Mid), and DL (Daily Low)
For Monday levels: MonH (Monday High), MonM (Monday Mid), and MonL (Monday Low)
For monthly levels: MH (Monthly High), MU50 (Monthly 50 percent of Mid and High), MM (Monthly Mid), MD50 (Monthly 50 percent of Mid and Low), and ML (Monthly Low)
For quarterly levels: 3MH (Quarterly High), 3MU50 (Quarterly 50 percent of Mid and High), 3MM (Quarterly Mid), 3MD50 (Quarterly 50 percent of Mid and Low), and 3ML (Quarterly Low)
For yearly levels: YH (Yearly High), YU50 (Yearly 50 percent of Mid and High), YM (Yearly Mid), YD50 (Yearly 50 percent of Mid and Low), and YL (Yearly Low)
These labels can help you quickly identify the different levels and keep track of important price points.
If the chosen timeframe does not fall under the category of intraday, daily and Monday level will not be displayed.
Please feel free to send your suggestions to @z_mehran.

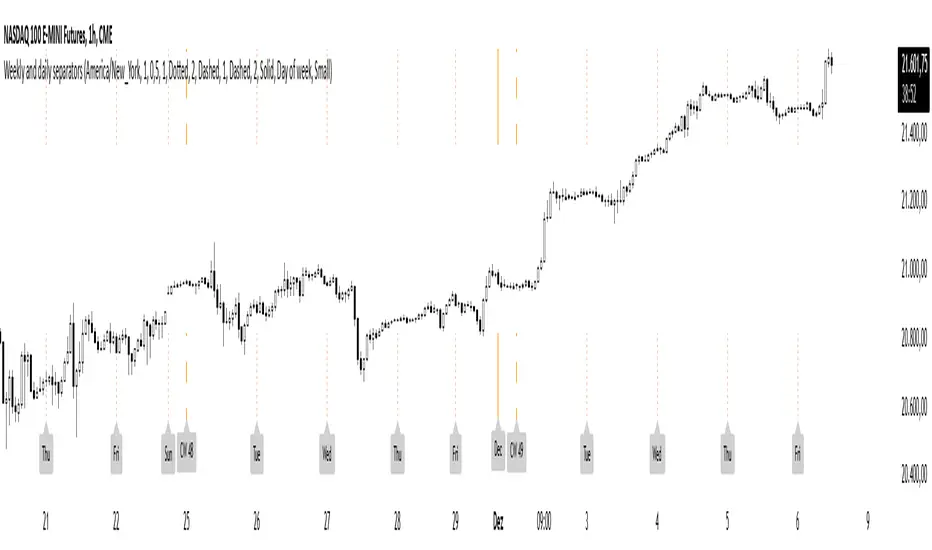
Weekly and daily separatorsThis script plots vertical line between each trading week (thick, solid) and smaller lines (dotted) between each trading day. This helps kepping a better overview on the aspect of time on the higher timeframes below 1D. The distance of the lines to the top and bottom of the chart is controlled by your chart settings menu under Appearance -> Margins.
ADR/AWR/AMR Average Daily+Weekly+Monthly Range[Traders Reality]Advanced ADR/AWR/AMR indicator created for Traders Reality community, as well as the greater trading community.
Thanks to the TR community discord guys: infernix, peshocore and xtech5192
Everything is modular and can be turned on/off, including a customisable table showing daily/weekly/monthly average pips/dollars.
If you just want the average daily range lines for example, you can just disable everything else. You can choose how many days to look back; as well as for weeks or months.
Check out Traders Reality on YouTube if you want to see this implemented as part of Tino's strategy that utilizes market manipulation, imbalances, times of day etc.
Price regularly reverses from ADR, making it one of the few highly valuable indicators in price action/smart money trading.

RD Key Levels (Weekly, Daily, Previous vWAP)The RexDog Key Levels indicator plots the weekly open, daily open, and the previous day vWAP close.
These are all critical price levels (zones) to know when trading any market or instrument. These areas are also high probability reaction areas that you can trade using simple confirmation trading patterns.
First, I'll cover an overview of the indicator then I'll share general usage tips.
Weekly Open - default is white/orange. White is when price is above the weekly open. Orange is when price is below the weekly open.
Weekly High/Low - there are options to turn on the weekly high and lows. Default plot is circles. Green is the high. Red is the low.
Daily Open - default is green/red. Green is when price is above the daily open. Red is when price is below the daily open.
Previous vWAPs - aqua single lines. These are the closing price of the daily vWAPs.
Top Indicators - The triangles at the top of the chart signify is price is currently above or below the weekly open. This is helpful on lower timeframe charts (5m, 15m) to get a quick indication when price is far extended beyond the weekly open. Green triangle = above weekly open. Red triangle = below weekly open.
General Usage
Each one of these levels are important levels markets look use for continuation or failure of momentum and bias. I also find it extremely helpful to think of these levels as magnets, dual magnets. They both attract and repel price at the same time. Now you might say, how is that helpful to have opposing views at the same time? Be indifferent to direction, create your own rules on when these price zones repel or attract price, I have my own.
Here's the easiest way to use these price levels.
As price approaches one of these levels to expect a reaction. A reaction is price is going in one direction and price hits a price level zone and reacts in the opposite direction.
These are price zones, sometimes you will see a reaction right at the price but visualize these areas as zones of reaction.
A high percentage of the time when price approaches these level zones there will be a reaction. So trade the reaction .
How do you do that?
Simple. Trade patterns that repeat. I have 3 solid patterns I trade around these key levels:
The first pattern is early entry with precise scale in rules and a very effective protective stop loss placement.
The second pattern is wait for confirmation that the level holds. This requires more patience and for you to fully trust the chart. The benefit of this pattern is with confirmation you have even more precise stop placement.
There is a bonus third pattern I trade around these levels. I call this the confirmation and bluff entry. It's a combination of both of the patterns above. You wait for confirmation but on any pull back you call the bluff on the market and enter on key test. Trade management here is critical. In addition to the pattern you trade you should have a series of failure patterns that tell you to get out of the trade, I use 2 primary failure patterns.
I trade all markets, same system, same rules, so I'll show a few examples.
Usually I start with Bitcoin but let's start with equities:
BA - Boeing - 8 Trades
Here we see weekly low patterns, previous week low test, vwAP hold patterns, day magnets and day holding. Then 2 week failures and a double hold pattern.
These are all straightforward trades to execute following really simple patterns.
BTCUSD Previous vWAP and Day Open Trades
We see here on the circle areas both daily open and previous day vWAP zone tests. Within this chart are all 3 highly effective patterns I trade.
SPY - 7 High Probability Trades
Here we see a pDay vWAP mixed with a daily failure. Next a daily retest, then a pDay vWAP failure, then a vWAP capture and test. Then a double weekly failure test (great trade there) and finally a daily test.
I could provide more examples but most are just derivatives of the above examples.

Stock Data Table█ OVERVIEW
This is a table that shows some information about stocks. It is divided into four sections:
1) Correlation
2) Shares
3) Daily Data
4) Extended Session Data
The table is completely modular, which means you can add or remove each element from the settings menu, and it will automatically rearrange its spaces.
It is also highly customizable, to the extent that you can change almost any color, remove or change titles, invert section rows, and much more.
1) Correlation
The script checks if the stock is listed on NASDAQ, and if so, uses the QQQ (Nasdaq-100 ETF) as the reference index in the first cell; otherwise, it uses the SPY (S&P 500 ETF). The length of the correlation is shown in the second cell. The table then displays the correlation between the reference index and the other index, and the correlation between the reference index and the stock.
To make it easier to interpret the correlation values, each row's last cell is color-coded with a gradient to highlight the type of correlation, and the direction of the gradient can be customized.
The correlation coefficient is a statistical measure that quantifies the strength and direction of the relationship between two variables, indicating how changes in one variable are associated with changes in the other variable, so it can be used to identify patterns and trends.
If you are interested in correlation, I suggest taking a look at my dedicated indicator:
2) Shares
This feature provides you with quick access to key information about shares and market capitalization.
On one row, you can view the total shares outstanding and the market capitalization for the fiscal year or the quarterly year. The total shares outstanding represents the total number of shares of the stock that have been issued and are currently outstanding, regardless of whether they are held by insiders or public investors. The market capitalization is a widely used measure of the company's value as determined by the stock market, calculated by multiplying its current stock price with the total number of outstanding shares.
The other row shows the float, which is the number of shares of a company that are available for public trading, and the corresponding free-float market cap, calculated by multiplying the company's current stock price with the float. Because Pine Script does not allow retrieving information about quarterly year float, you can view the float and the free-float market cap of the fiscal year only. The data can be displayed at all times or only when the difference between the total shares outstanding and the float is significant enough to result in a difference between the market cap and free-float market cap.
The classification for market cap and free-float market cap is set in this way:
Mega Cap: $200 billion or more
Large Cap: between $10 billion and $200 billion
Mid Cap: between $2 billion and $10 billion
Small Cap: between $300 million and $2 billion
Micro Cap: less than $300 million
Penny Stocks: less than $5 (customizable)
Comparing the free-float market cap to the market cap can provide insights into the liquidity of a stock. In fact, if the float is relatively small compared to the total shares outstanding, it may be more difficult to find buyers or sellers, which could lead to increased volatility. On the other hand, a larger float indicates that the stock is more liquid and may be easier to trade, potentially resulting in lower volatility. However, market conditions can change quickly and significantly, especially for intraday traders, and the free-float can also change as insiders or other large shareholders buy or sell shares. Therefore, comparing the data of the fiscal year with that of the quarterly year may not provide the most up-to-date and accurate information for making trading decisions. This limitation can be mitigated by combining those data with other indicators and tools, such as technical analysis or news events, to gain a better understand of the stock's performance and potential trading opportunities.
3) Daily Data
This section is available on daily charts only due to the lack of accuracy of real-time daily data on other time frames. Here, you can view the Average Daily Volume (ADV) over a preferred time range (20 days by default), and the Daily Change, which represents the percentage difference between the closing price on two consecutive trading days.
ADV is useful in measuring the stock's volatility, as it provides an indication of how much trading activity there is in it. Generally speaking, stocks with higher trading volume tend to be less volatile than stocks with lower trading volume. High trading volume means there are more buyers and sellers actively trading the stock, which makes it easier for investors to buy and sell shares at fair prices. This increased liquidity can help to stabilize the stock price, reducing the potential for large swings in either direction. On the other hand, stocks with lower trading volume may experience greater volatility, as there are fewer buyers and sellers actively trading the stock. This can result in larger price swings, as it may be more difficult for investors to buy or sell shares at fair prices.
The daily percentage change can provide an indication of the stock's volatility, with larger values indicating greater volatility and risk. It can also be compared to that of a benchmark such an index or other stocks in the same sector, helping to determine whether the stock is outperforming or underperforming relative to them.
4) Extended Session Data
The fourth section is available on intraday charts only. This section provides two pieces of information: the Extended Session Change and the Pre-Market Volume.
The Extended Session Change indicates the percentage difference between the previous day's closing price and the latest price in the extended session. This gives you the extent and the direction of the price gap that occurred during extended trading hours.
The Pre-Market Volume shows the sum of all shares traded during the pre-market session. This can be helpful in understanding how much interest the stock gained before the market opened.
By default, the two rows will be visible at all times. They will stop updating after the end of their respective time range, and resume updating when it starts again. However, you can choose to automatically hide them outside of their time ranges.
Both the extended session and pre-market time ranges can be customized. Please note that if you select time ranges outside of the regular market session (as set by default), you must enable the extended session to view the corresponding rows.
█ GENERAL NOTES
• Total Shares Outstanding, Float, Average Daily Volume and Pre-Market Volume cells use a customizable color system based on two thresholds, to help you quickly identify whether the value is "too low/acceptable/too high" or "too low/not enough high/acceptable".
• If you cannot see certain data, that simply means it is not available.

Buy Sell Calendar [LuxAlgo]The Buy Sell Calendar indicator displays a calendar showing the sentiment for the current day/month. Three different methods can be used to determine this sentiment.
The calendar can also highlight the percentage of bullish days/months for a month/year.
🔶 SETTINGS
Frequency: Calendar frequency, options include "Daily" and "Monthly"
Sentiment Method: Method used to determine the sentiment for the day/month, options include: "Linreg", "Accumulated Deltas", and "Max/Min"
Timezone Offset: UTC time zone offset.
Limit Date: Limit date used by the calendar, the sentiment of days/months outside this limit will not be returned.
🔹 Calendar
Show Calendar: Determines whether to display or hide the calendar.
Location: Location of the calendar on the chart.
Size: Calendar size.
🔶 USAGE
The proposed script can allow users to quickly determine if a specific day/month is considered bullish or bearish. A green cell is used for bullish days/months, while a red one is used for bearish days/months.
Additionally vertical lines are displayed on new days/months with a color highlighting the current sentiment for this specific day/month. Note that this is done retrospectively, the color of a line set at time t might differ at time t+n .
🔶 SENTIMENT METHODS
Determining whether a day/month is bullish or bearish can be done using three different methods. Note that each method makes use of the closing price as the input, and as such can eventually return different results depending on the selected timeframe. Each method is described below:
🔹 Linreg
The Linreg method fit lines between each day/month using the method of least squares and determines if that particular day is bullish or bearish based on the line slope sign. For example, a rising line would indicate a bullish day/month.
🔹 Accumulated Deltas
The method of accumulated deltas simply accumulates bullish and bearish price changes for the current day/month, the result with the highest magnitude determines the sentiment for that day/month.
🔹 Max/Min
The max/min method computes a trailing maximum and a trailing minimum for the current day/month. The sentiment is determined by the price position relative to the average between the obtained maximum/minimum, with a bullish sentiment being determined if price is above the average.
