OPEN-SOURCE SCRIPT
Inside Candle by Harshini
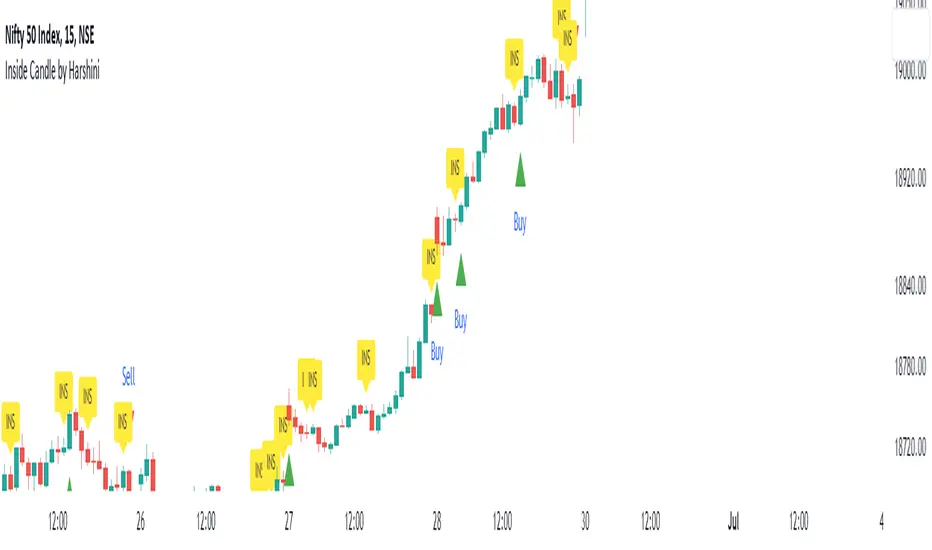
The concept behind this indicator is that the inside candle indicates a pause in the current move and the following candle after inside candle will indicate the direction of the next move. This indicator informs you when an inside candle is formed and based on the next candle, it gives you buy/sell signal.
When an inside candle is formed, a label will appear above the candle, which makes it very easy to identify the inside candle in live charts. Once the inside candle is formed, the Buy/Sell signal depends on the next candle. If the candle formed after the inside candle gives a breakout above then "Buy" signal is indicated, you can take a trade with 1:2 risk reward. Similarly if the next candle gives a breakout below, then a "Sell" signal is generated and you can take a sell with 1:2 risk reward. This indicator can be applied to any chart like stocks, crypto, commodities etc...
Here's how you can trade using this indicator:
1) Apply this indicator in a 15 mins time frame :
Even though this indicator identifies inside candle formation in almost every time frame, it works very well when applied to a 15 mins chart.
2) Always keep minimum 1:2 Risk Reward :
While taking trades initially, stick on to 1:2 risk reward. If there are other confluences as well along with the inside candle, you can book target accordingly.
Note : It is observed that this indicator works well in a trending market and not in ranging bound market.
開源腳本
秉持TradingView一貫精神,這個腳本的創作者將其設為開源,以便交易者檢視並驗證其功能。向作者致敬!您可以免費使用此腳本,但請注意,重新發佈代碼需遵守我們的社群規範。
免責聲明
這些資訊和出版物並非旨在提供,也不構成TradingView提供或認可的任何形式的財務、投資、交易或其他類型的建議或推薦。請閱讀使用條款以了解更多資訊。
開源腳本
秉持TradingView一貫精神,這個腳本的創作者將其設為開源,以便交易者檢視並驗證其功能。向作者致敬!您可以免費使用此腳本,但請注意,重新發佈代碼需遵守我們的社群規範。
免責聲明
這些資訊和出版物並非旨在提供,也不構成TradingView提供或認可的任何形式的財務、投資、交易或其他類型的建議或推薦。請閱讀使用條款以了解更多資訊。