OPEN-SOURCE SCRIPT
已更新 VIX Filter/RSI/EMA Bias/Cum-TICK w/ Exhaustion Zone Dashboard
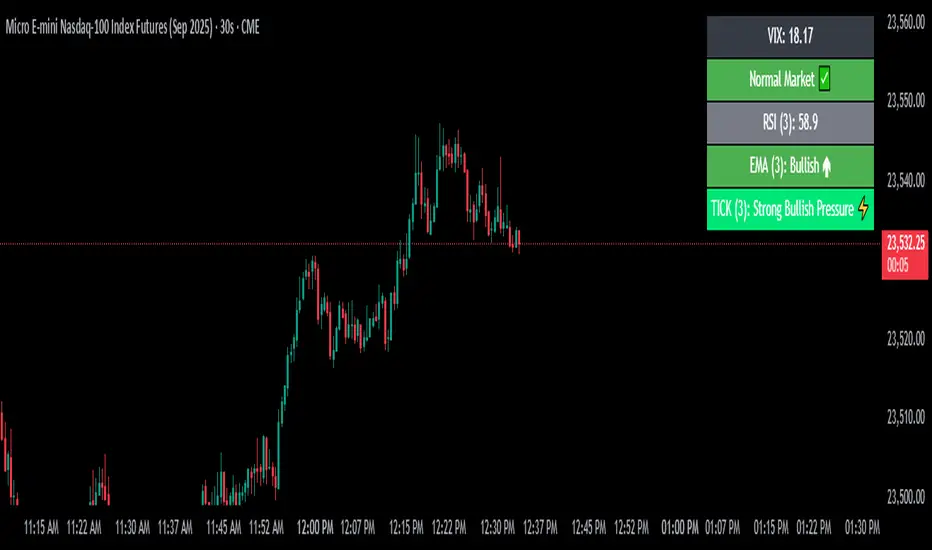
This all-in-one dashboard gives intraday traders a real-time visual read of market conditions, combining volatility regime, trend bias, momentum exhaustion, and internal strength — all in a fully customizable overlay that won’t clutter your chart.
📉 VIX Market Regime Detector
Identifies "Weak", "Normal", "Volatile", or "Danger" market states based on customizable VIX ranges and symbol (e.g., VXN or VIX).
📊 RSI Momentum Readout
Displays real-time RSI from any selected timeframe or symbol, with adjustable length, OB/OS thresholds, and color-coded exhaustion alerts.
📈 EMA Trend Bias Scanner
Compares fast and slow EMAs to define bullish or bearish bias, using your preferred timeframe, symbol, and EMA lengths — ideal for multi-timeframe setups.
🧠 Cumulative TICK Pressure & Exhaustion Engine
Analyzes internal market strength using cumulative TICK data to classify conditions as:
-Strong / Mild Bullish or Bearish Pressure
-Choppy / No Edge
-⚠️ Exhaustion Zones — when raw TICK values hit extreme highs/lows, a separate highlight box appears in the dashboard, warning of potential turning points
All logic is customizable, including TICK symbol, timeframes, thresholds, and lookback periods.
Scalpers and day traders who want fast, visual insight into market internals, exhaustion, and trend bias.
發行說明
Added a warning icon (⚠️) after the RSI value in the dashboard when RSI is overbought or oversold, complementing the existing color change to make extreme RSI conditions easier to spot發行說明
⚠️ Added Chart Timeframe Warning: Chart timeframe must be equal to or lower than the selected indicator timeframes (RSI, EMA, TICK, VIX) to ensure accurate readings.開源腳本
秉持TradingView一貫精神,這個腳本的創作者將其設為開源,以便交易者檢視並驗證其功能。向作者致敬!您可以免費使用此腳本,但請注意,重新發佈代碼需遵守我們的社群規範。
免責聲明
這些資訊和出版物並非旨在提供,也不構成TradingView提供或認可的任何形式的財務、投資、交易或其他類型的建議或推薦。請閱讀使用條款以了解更多資訊。
免責聲明
這些資訊和出版物並非旨在提供,也不構成TradingView提供或認可的任何形式的財務、投資、交易或其他類型的建議或推薦。請閱讀使用條款以了解更多資訊。