OPEN-SOURCE SCRIPT
AmirAli 20 Pairs/USDT&BTC
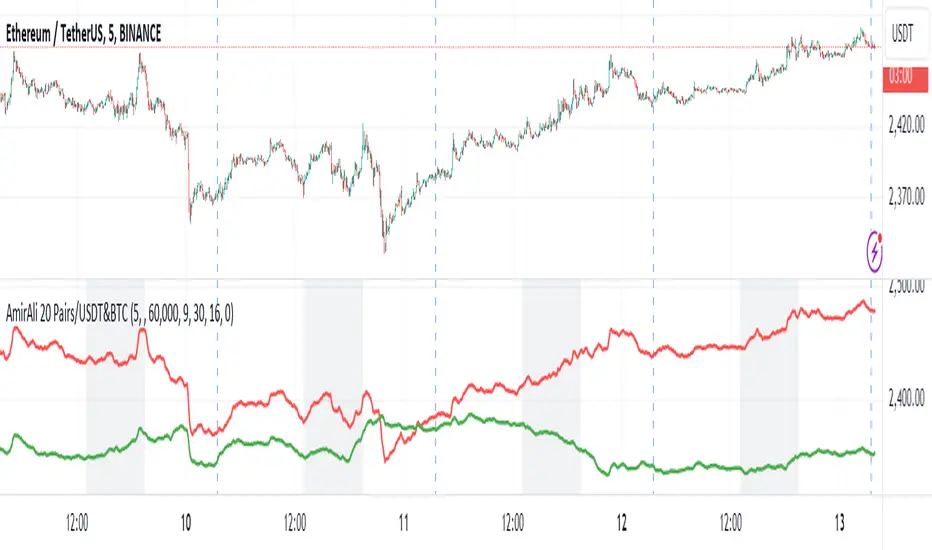
This TradingView indicator, titled "20 Pairs/USDT&BTC," is designed to analyze and display the Exponential Moving Averages (EMAs) of various cryptocurrency pairs against USDT and BTC. Here's a detailed breakdown of its features, functionality, and usage:
Key Features:
Pairs Display: The indicator allows users to select which cryptocurrency pairs they wish to display on the chart. The available options include popular cryptocurrencies such as Ethereum (ETH), Binance Coin (BNB), Solana (SOL), Dogecoin (DOGE), Ripple (XRP), Litecoin (LTC), Polkadot (DOT), Avalanche (AVAX), Uniswap (UNI), Chainlink (LINK), Cardano (ADA), Cosmos (ATOM), Filecoin (FIL), Stellar (XLM), VeChain (VET), Enjin (ENJ), Celo (CELO), Hedera (HBAR), and Sandbox (SAND).
Dynamic Price Retrieval: For each selected pair, the indicator retrieves the closing prices for both USDT and BTC from Binance. This is done using the request.security function, which fetches real-time data.
EMA Calculation: The indicator calculates and plots the EMA for each cryptocurrency pair over a user-defined length, allowing traders to identify trends and potential buy/sell signals based on price movements relative to their EMAs.
User Customization: Users can customize several parameters, including the time frame for data retrieval, EMA length, and the visibility of each pair.
Market Hours Visualization: The indicator highlights the trading hours with a gray background, helping users identify when the market is active.
How to Use the Indicator:
Adding the Indicator: To use the indicator, add it to your TradingView chart by searching for "20 Pairs/USDT&BTC" in the public library or by pasting the provided Pine Script code into a new indicator script.
Select Pairs: Enable or disable specific cryptocurrency pairs in the input options at the top of the script. For example, if you want to analyze ETH and ADA, ensure that the respective boxes are checked.
Adjust Time Frame: Set the time frame for the indicator. You can choose any time frame or leave it blank to use the current chart's time frame.
Set EMA Length: Choose the length for the EMA calculation based on your trading strategy. A shorter EMA (e.g., 5) reacts more quickly to price changes, while a longer EMA (e.g., 20) smooths out price fluctuations.
Observe Trends: Monitor the plotted EMAs for the selected pairs. Crossovers of the price with the EMA can indicate potential buy or sell signals. For instance, if the price crosses above the EMA, it may signal a bullish trend, whereas a crossover below could indicate a bearish trend.
Consider Market Hours: Pay attention to the gray background during U.S. trading hours, as this may indicate higher volatility and trading opportunities.
Conclusion
The "20 Pairs/USDT&BTC" indicator is a powerful tool for cryptocurrency traders looking to analyze multiple pairs simultaneously. By providing a visual representation of EMAs, it aids in identifying trends and potential trading opportunities in a user-friendly manner. Make sure to adapt the settings according to your trading strategy and market conditions for optimal results.
Amir Hasankhah & Ali Beyki
開源腳本
本著TradingView的真正精神,此腳本的創建者將其開源,以便交易者可以查看和驗證其功能。向作者致敬!雖然您可以免費使用它,但請記住,重新發佈程式碼必須遵守我們的網站規則。
免責聲明
這些資訊和出版物並不意味著也不構成TradingView提供或認可的金融、投資、交易或其他類型的意見或建議。請在使用條款閱讀更多資訊。
開源腳本
本著TradingView的真正精神,此腳本的創建者將其開源,以便交易者可以查看和驗證其功能。向作者致敬!雖然您可以免費使用它,但請記住,重新發佈程式碼必須遵守我們的網站規則。
免責聲明
這些資訊和出版物並不意味著也不構成TradingView提供或認可的金融、投資、交易或其他類型的意見或建議。請在使用條款閱讀更多資訊。