INVITE-ONLY SCRIPT
已更新 Multi Time Frame - Trend Analysis
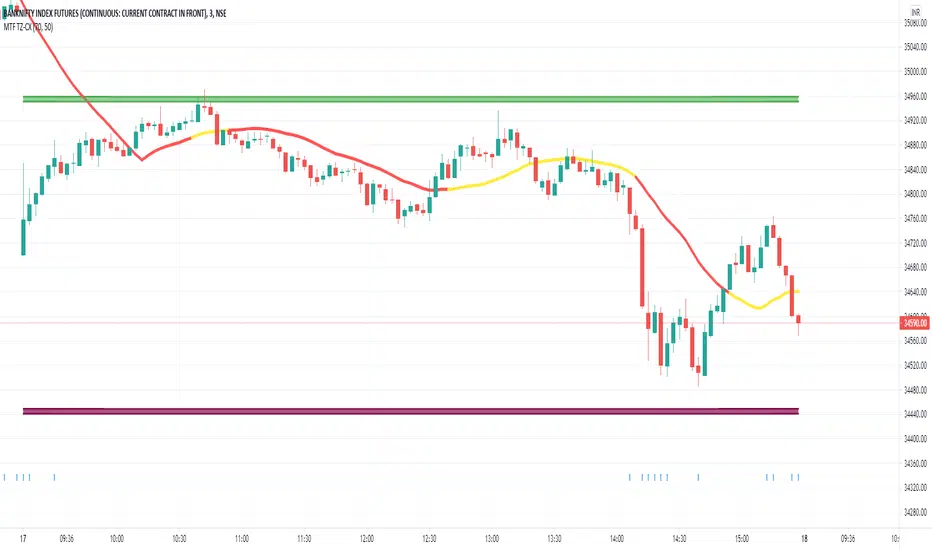
Muti Time Frame - Trend Analysis
How does it work ? Price movements over range of period is to compute the trend forward.
This script used SuperTrend (ST) , ATR and RSI to determine the trend and direction so that a buy sell decision can be made
To Indicate the strength of the trendline , RSI is computed over multiple timeframes and then used to in sync with SuperTrend to help determine the direction
The user can customise the RSI strength validation. So one the Super Trend and ATR Levels are matched , the RSI is validated before giving a BUY/SELL suggestion
Best Time Frames to use : Upto 15/30 Mins if using RSI based logic , user can use higher timeframe if the goal is to identify the trend and the use lower time frame to determine Buy/Sell
Where to use
Trend Indicator using Multi Time Frame Analysis to suggest a long or a short
The main use of this indicator is quick scalping and Intra-day trading.
The Indicator shows the option to show the Trend Zone and Buy/Sell Signals which the use can on or off
How to use
User Choices : To avoid false positives we have introduced a double check using RSI ,
it is defaulted to 60/ 40 - the users are free to change it as per their preferences
The system will not suggest a trade when the the counter in beyond the RSI limits
Stop Loss - That should be done by following ones risk appetite , Ideally the open/close of the previous candle should be the stop loss for the buy/sell
but everyone has their own Risk Management Strategies based on the capital deployed.
Disclaimer : There could be scenarios when the candle is shown as a long or short and then the candle turns into opposite direction red/green .
In such scenarios , Please refer to the just preceding candle and if this candle is moving into positive direction (forming green candle) only then buy ,
Similarly Sell/Short only if this candle is forming a red candle
How to get access
Please click on the link / email in the signature or send me a private message to get access
Feedback
Please click on the link/email in the signature or send me a private message for suggestions/feedbacks
發行說明
The Updated Version of the Script now gives the ability to switch to VWAP as the trendline Both Old SMA Based and New VWAP Based Trend lines Co Exist and the user can choose between what needs to be used ,
Both trend line continue to depict the strength based on the hybrid calculation of RS
The two new addons are VWMA 20 and the ability for the users to highlight candles which shows more than certain volume
This can be used to identify false breakouts where the price may momentarily move up the
trend lines but the lack of volume may lead to a return
Please share your comments and feedback in the comment area below
發行說明
Added the option to enable the strength as an Input from the user , Similar to RSI the strength can be a number between 50-80System will calculate the other numbers accordingly
Best Time Frame to use 3 Minutes
僅限邀請腳本
僅作者批准的使用者才能訪問此腳本。您需要申請並獲得使用許可,通常需在付款後才能取得。更多詳情,請依照作者以下的指示操作,或直接聯絡PortfolioBuddy。
TradingView不建議在未完全信任作者並了解其運作方式的情況下購買或使用腳本。您也可以在我們的社群腳本中找到免費的開源替代方案。
作者的說明
All options are unticked by default Select the Trend line .
Use one of the Trendlines based on your choice
Super trend can be enabled to make a short term buy sell decisions
Volume indicators can be enabled to identify volume movements
Best TF : 3/5 M
Email : portfoliobuddyts@gmail.com
免責聲明
這些資訊和出版物並非旨在提供,也不構成TradingView提供或認可的任何形式的財務、投資、交易或其他類型的建議或推薦。請閱讀使用條款以了解更多資訊。