INVITE-ONLY SCRIPT
ICT AMD
What the indicator does
This indicator, named "ICT AMD indicator", is designed for traders who follow the ICT (Inner Circle Trader) theory, focusing on identifying and visualizing phases of market structure related to Accumulation, Manipulation, and Distribution. These phases are crucial for understanding the market's direction and potential turning points. The indicator:
How the indicator does it
The indicator implements its functionality through a series of calculated steps and conditions:
How traders can use it
Traders can leverage the "ICT AMD indicator" to enhance their market analysis and decision-making process:
By understanding and utilizing the visual and analytical insights provided by the "ICT AMD indicator", traders can potentially improve their trading outcomes by aligning their strategies with the underlying market dynamics it reveals.
This indicator, named "ICT AMD indicator", is designed for traders who follow the ICT (Inner Circle Trader) theory, focusing on identifying and visualizing phases of market structure related to Accumulation, Manipulation, and Distribution. These phases are crucial for understanding the market's direction and potential turning points. The indicator:
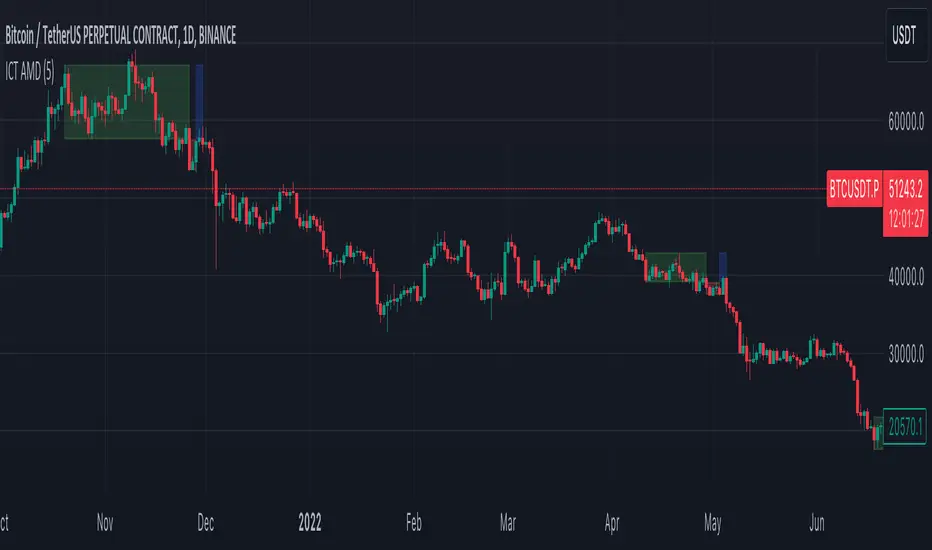
- Draws boxes on the chart to represent Accumulation, Manipulation, and Distribution areas, providing a visual representation of these key market phases.
- Highlights areas where the market is likely accumulating assets before a big move, manipulating prices to trigger retail stop losses, and distributing assets after a significant price move.
How the indicator does it
The indicator implements its functionality through a series of calculated steps and conditions:
- Utilizes pivot points to identify potential swing highs and lows within the market, which serve as the basis for determining the phases of Accumulation, Manipulation, and Distribution.
- Allows users to customize the pivot range and whether to include wicks in the pivot calculation, giving flexibility in identifying swing points based on personal trading style or strategy.
- Creates visual boxes on the chart where these phases are identified:
Accumulation boxes are drawn when the market is perceived to be gathering assets, indicated by a specific price behavior around swing lows.
Manipulation boxes appear around price levels where the market is likely pushing beyond key accumulation or distribution zones, possibly to trigger stop-loss orders.
Distribution boxes are established following the manipulation phase, indicating areas where the market is offloading assets post-accumulation.
- Adjusts the right edge of these boxes as new price information becomes available, ensuring they remain relevant and accurate to current market conditions.
- Employs color coding (green for Accumulation, red for Manipulation, and blue for Distribution) to make the distinction between different market phases clear and intuitive.
How traders can use it
Traders can leverage the "ICT AMD indicator" to enhance their market analysis and decision-making process:
- Identify potential entry and exit points by observing the transitions between Accumulation, Manipulation, and Distribution phases.
- Adjust their risk management strategies based on the identification of Manipulation areas, which could indicate areas of high stop-loss activity.
- Use the Accumulation and Distribution boxes to gauge the strength of a trend or potential reversal points, as these areas often precede significant market moves.
- Incorporate the indicator's insights with other analysis tools or indicators to confirm trade hypotheses or to refine entry and exit strategies.
- Apply the visual cues provided by the indicator to anticipate market moves based on historical patterns of Accumulation, Manipulation, and Distribution, aligning their trading strategies with the inferred market psychology.
By understanding and utilizing the visual and analytical insights provided by the "ICT AMD indicator", traders can potentially improve their trading outcomes by aligning their strategies with the underlying market dynamics it reveals.
僅限邀請腳本
僅作者批准的使用者才能訪問此腳本。您需要申請並獲得使用許可,通常需在付款後才能取得。更多詳情,請依照作者以下的指示操作,或直接聯絡GreatestUsername。
TradingView不建議在未完全信任作者並了解其運作方式的情況下購買或使用腳本。您也可以在我們的社群腳本中找到免費的開源替代方案。
作者的說明
Go for gold
免責聲明
這些資訊和出版物並非旨在提供,也不構成TradingView提供或認可的任何形式的財務、投資、交易或其他類型的建議或推薦。請閱讀使用條款以了解更多資訊。
僅限邀請腳本
僅作者批准的使用者才能訪問此腳本。您需要申請並獲得使用許可,通常需在付款後才能取得。更多詳情,請依照作者以下的指示操作,或直接聯絡GreatestUsername。
TradingView不建議在未完全信任作者並了解其運作方式的情況下購買或使用腳本。您也可以在我們的社群腳本中找到免費的開源替代方案。
作者的說明
Go for gold
免責聲明
這些資訊和出版物並非旨在提供,也不構成TradingView提供或認可的任何形式的財務、投資、交易或其他類型的建議或推薦。請閱讀使用條款以了解更多資訊。