OPEN-SOURCE SCRIPT
Distance Bands Oscillator_KT
█ OVERVIEW
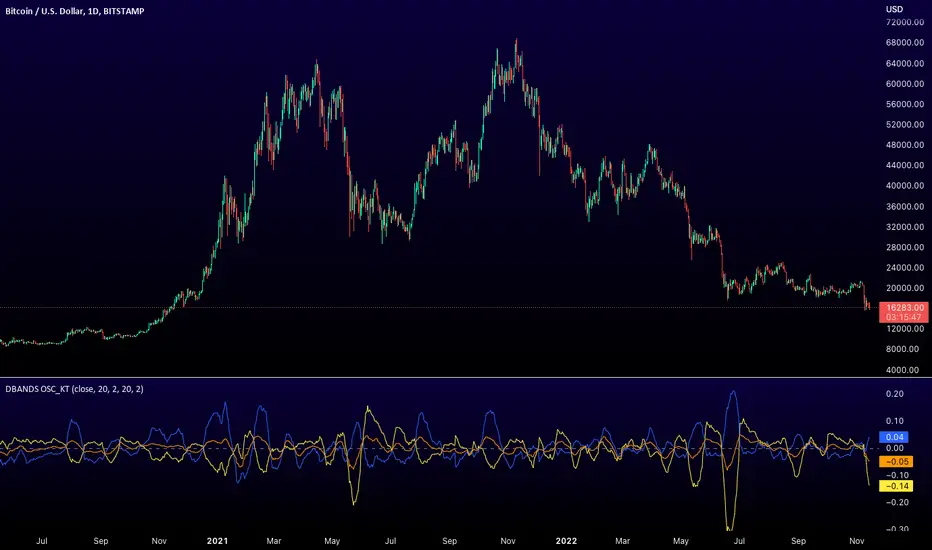
This tool is based on both Bollinger Bands and Keltner Channels, and measures 3 distances between the two, respectively.
Similar to the Band Width indicator, this can be used as a measure of volatility, and can be used to measure uptrend, downtrend and chop regions on a given chart.
Happy Trading,
ET
This tool is based on both Bollinger Bands and Keltner Channels, and measures 3 distances between the two, respectively.
- Upper Kelt to Upper Bollinger Band
- Lower Kelt to Lower Bollinger Band
- Kelt Basis to Bollinger Basis Basis
Similar to the Band Width indicator, this can be used as a measure of volatility, and can be used to measure uptrend, downtrend and chop regions on a given chart.
Happy Trading,
ET
開源腳本
本著TradingView的真正精神,此腳本的創建者將其開源,以便交易者可以查看和驗證其功能。向作者致敬!雖然您可以免費使用它,但請記住,重新發佈程式碼必須遵守我們的網站規則。
Eric Thies
免責聲明
這些資訊和出版物並不意味著也不構成TradingView提供或認可的金融、投資、交易或其他類型的意見或建議。請在使用條款閱讀更多資訊。
開源腳本
本著TradingView的真正精神,此腳本的創建者將其開源,以便交易者可以查看和驗證其功能。向作者致敬!雖然您可以免費使用它,但請記住,重新發佈程式碼必須遵守我們的網站規則。
Eric Thies
免責聲明
這些資訊和出版物並不意味著也不構成TradingView提供或認可的金融、投資、交易或其他類型的意見或建議。請在使用條款閱讀更多資訊。