OPEN-SOURCE SCRIPT
Pre Market High/Low Levels
Pre Market High & Pre Market Low By Jadra
Pre Market High/Low Levels Indicator
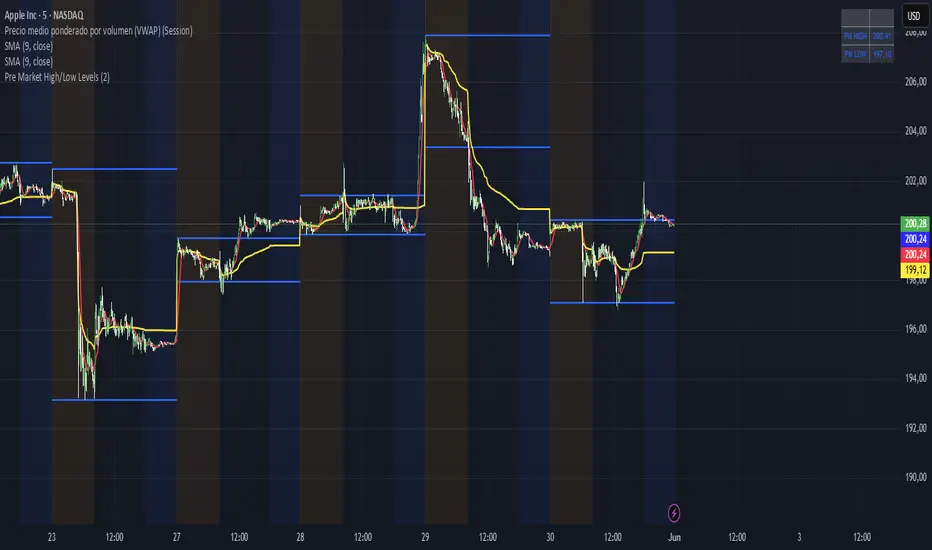
This indicator automatically identifies pre-market high and low levels (4:00-9:30 AM ET) and marks them with blue horizontal lines that extend throughout the entire trading session. Perfect for NYSE and NASDAQ traders who use these key levels as support and resistance. Features color-coded backgrounds: yellow for pre-market, transparent for regular hours, and blue for post-market. Lines remain visible from pre-market through market close, providing constant visual references for making trading decisions based on these important psychological levels. Essential tool for day traders focusing on overnight price action and gap analysis in US equity markets.
Pre Market High/Low Levels Indicator
This indicator automatically identifies pre-market high and low levels (4:00-9:30 AM ET) and marks them with blue horizontal lines that extend throughout the entire trading session. Perfect for NYSE and NASDAQ traders who use these key levels as support and resistance. Features color-coded backgrounds: yellow for pre-market, transparent for regular hours, and blue for post-market. Lines remain visible from pre-market through market close, providing constant visual references for making trading decisions based on these important psychological levels. Essential tool for day traders focusing on overnight price action and gap analysis in US equity markets.
開源腳本
秉持TradingView一貫精神,這個腳本的創作者將其設為開源,以便交易者檢視並驗證其功能。向作者致敬!您可以免費使用此腳本,但請注意,重新發佈代碼需遵守我們的社群規範。
免責聲明
這些資訊和出版物並非旨在提供,也不構成TradingView提供或認可的任何形式的財務、投資、交易或其他類型的建議或推薦。請閱讀使用條款以了解更多資訊。
開源腳本
秉持TradingView一貫精神,這個腳本的創作者將其設為開源,以便交易者檢視並驗證其功能。向作者致敬!您可以免費使用此腳本,但請注意,重新發佈代碼需遵守我們的社群規範。
免責聲明
這些資訊和出版物並非旨在提供,也不構成TradingView提供或認可的任何形式的財務、投資、交易或其他類型的建議或推薦。請閱讀使用條款以了解更多資訊。