INVITE-ONLY SCRIPT
已更新 Heiken Ashi
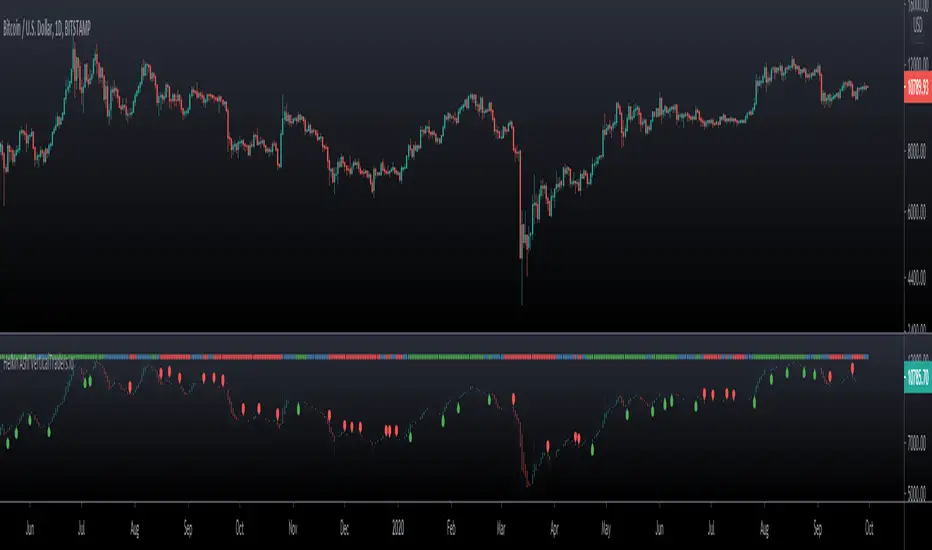
Heikin Ashi charts are similar to candle charts, but the main difference is that a Heikin Ashi chart uses daily price averages to show the movement of the average price of an asset.
The idea is to use the heikin Ashi technique as an indicator and not as the main chart, to avoid enter or exist the market too late.
Key concepts:
- The averaged open and close help filter some of the market noise, creating a chart that tends to highlight the trend direction better than typical candlestick charts.
- The downside is that some price data is lost with averaging. The most recent price (close) may not reflect the actual price of the asset, which could affect risk.
- Long down candles with little upper shadow represent strong selling pressure. Long up candles with small or no lower shadows signal strong buying pressure.
Extra functions in this indicator:
- Trend Bar indicator, uptrend(green), downtred(red), warning or indecision (yellow).
- Long and Short Labels base on trend and Heikin Ashi entries.
- Change the color of the main chart Candlesticks as the Heikin Ashi indicators.
- Alerts for long and short entries.
- Size of Labels.
發行說明
V 2.0發行說明
V 2.1僅限邀請腳本
只有經作者授權的使用者才能訪問此腳本,且通常需付費。您可以將此腳本加入收藏,但需先向作者申請並獲得許可後才能使用 — 點擊此處了解更多。如需更多詳情,請依照作者說明或直接聯繫Vertical-X。
除非您完全信任其作者並了解腳本的工作原理,否則TradingView不建議您付費或使用腳本。您也可以在我們的社群腳本中找到免費的開源替代方案。
作者的說明
提醒:在請求訪問權限之前,請閱讀僅限邀請腳本指南。
🔰 The Best Trading Indicators: links.verticaltraders.io
免責聲明
這些資訊和出版物並不意味著也不構成TradingView提供或認可的金融、投資、交易或其他類型的意見或建議。請在使用條款閱讀更多資訊。
僅限邀請腳本
只有經作者授權的使用者才能訪問此腳本,且通常需付費。您可以將此腳本加入收藏,但需先向作者申請並獲得許可後才能使用 — 點擊此處了解更多。如需更多詳情,請依照作者說明或直接聯繫Vertical-X。
除非您完全信任其作者並了解腳本的工作原理,否則TradingView不建議您付費或使用腳本。您也可以在我們的社群腳本中找到免費的開源替代方案。
作者的說明
提醒:在請求訪問權限之前,請閱讀僅限邀請腳本指南。
🔰 The Best Trading Indicators: links.verticaltraders.io
免責聲明
這些資訊和出版物並不意味著也不構成TradingView提供或認可的金融、投資、交易或其他類型的意見或建議。請在使用條款閱讀更多資訊。