OPEN-SOURCE SCRIPT
已更新 Candle Body Percentages Table
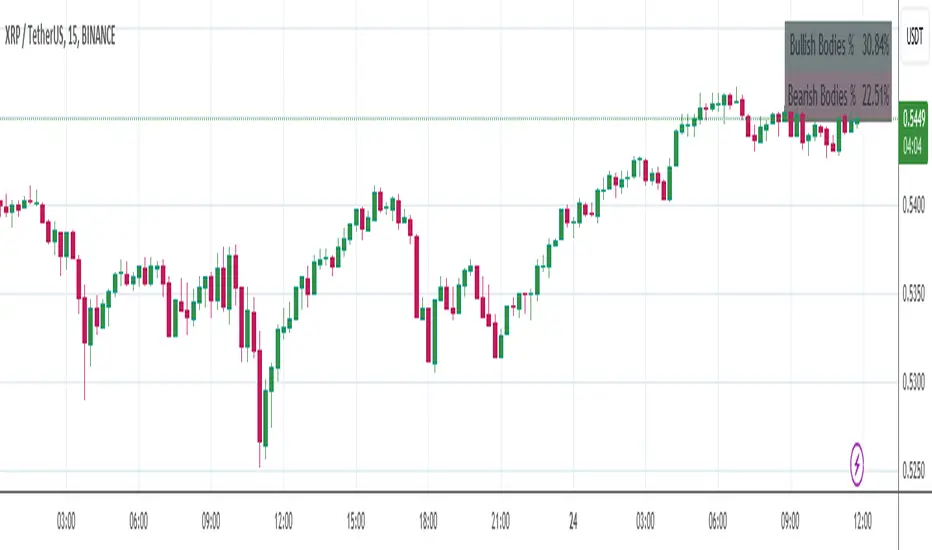
This script is designed as an analysis tool to visually represent the relative strength of bullish and bearish market sentiments over a specified number of candles. It calculates and displays the percentages of bullish and bearish "candle bodies" as part of the total price range observed in the chosen period.
Here's a breakdown of its functionalities:
User-Defined Period Analysis: Users can specify the number of candles they wish to analyze, allowing for flexible and dynamic examination of market trends over different time frames.
Bullish Body Percentage: The script calculates the combined length of all bullish candle bodies (where the closing price is higher than the opening price) within the selected range and expresses this total as a percentage of the combined price range of all candles analyzed.
Bearish Body Percentage: Similarly, it computes the aggregate length of all bearish candle bodies (where the closing price is lower than the opening price) and presents this sum as a percentage of the total price range.
Visual Representation: The results are displayed in a table format on the chart, providing an immediate visual summary of the prevailing market dynamics. The table shows the percentages of price movement dominated by bullish or bearish sentiment.
Market Sentiment Indicator: This tool can be particularly useful for traders and analysts looking to gauge market sentiment. High bullish body percentages might indicate strong buying pressure, while high bearish body percentages could suggest significant selling pressure.
Strategic Decision Making: By providing a clearer picture of market sentiment over a user-defined period, the script aids in making informed trading decisions, potentially enhancing trading strategies that are sensitive to trends and market momentum.
發行說明
Updated script name on chart開源腳本
秉持TradingView一貫精神,這個腳本的創作者將其設為開源,以便交易者檢視並驗證其功能。向作者致敬!您可以免費使用此腳本,但請注意,重新發佈代碼需遵守我們的社群規範。
免責聲明
這些資訊和出版物並非旨在提供,也不構成TradingView提供或認可的任何形式的財務、投資、交易或其他類型的建議或推薦。請閱讀使用條款以了解更多資訊。
免責聲明
這些資訊和出版物並非旨在提供,也不構成TradingView提供或認可的任何形式的財務、投資、交易或其他類型的建議或推薦。請閱讀使用條款以了解更多資訊。