OPEN-SOURCE SCRIPT
OHLC Means
Note: This indicator works only on daily timeframes.
The indicator calculates the OHLC averages for days corresponding to the day of the last displayed candlestick. For instance, if the last candlestick displayed is Monday, it calculates the OHLC average for all Mondays; if Tuesday, it does the same for all Tuesdays.
Customizable period: The indicator allows you to select the number of candlesticks to analyze, with a default value of 1000. This means it will consider the last 1000 candlesticks before the final displayed one. Assuming there are only five trading days per week, this corresponds to about 200 days. (not true for cryptos, you need to devide by 7)
Example scenario:
Today is Tuesday and we analyse NQ
By default, the indicator analyzes the last 1000 candlesticks (modifiable parameter).
Since there are five trading days in a week,
1000 ÷ 5 = 200
The indicator calculates the OHLC averages for the last 200 Tuesdays, corresponding to the past seven years. Of course it is not exactly 200 becauses the may be one tuesday where the market is closed (if christmas is on tuesday for instance)
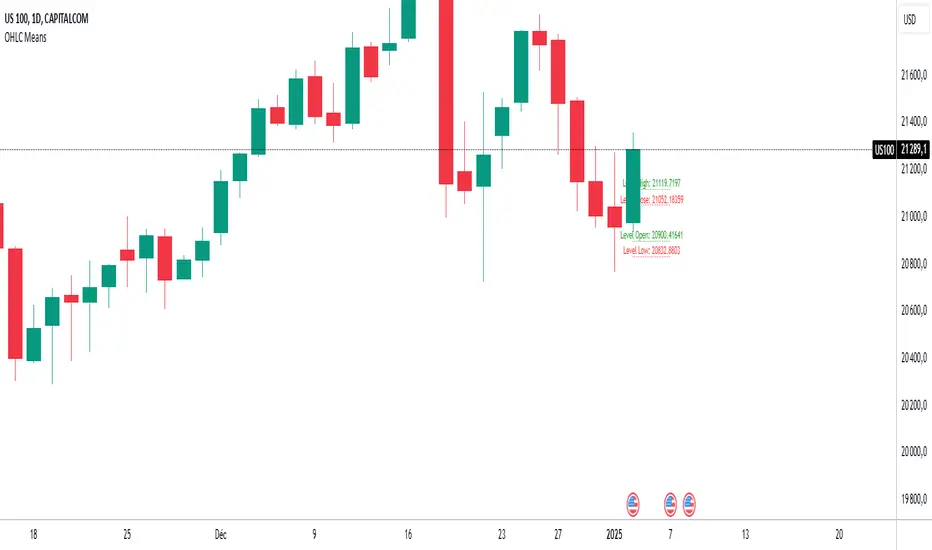
Output:
Displays four daily averages as four lines with their levels as labels :
High and Low averages are displayed at the extremes.
Open and Close averages are displayed at the center.
Color coding:
Red indicates bearish movement.
Green indicates bullish movement.
Usage recommendations:
Best suited for assets with a significant historical dataset.
Only functional on daily timeframes.
The indicator calculates the OHLC averages for days corresponding to the day of the last displayed candlestick. For instance, if the last candlestick displayed is Monday, it calculates the OHLC average for all Mondays; if Tuesday, it does the same for all Tuesdays.
Customizable period: The indicator allows you to select the number of candlesticks to analyze, with a default value of 1000. This means it will consider the last 1000 candlesticks before the final displayed one. Assuming there are only five trading days per week, this corresponds to about 200 days. (not true for cryptos, you need to devide by 7)
Example scenario:
Today is Tuesday and we analyse NQ
By default, the indicator analyzes the last 1000 candlesticks (modifiable parameter).
Since there are five trading days in a week,
1000 ÷ 5 = 200
The indicator calculates the OHLC averages for the last 200 Tuesdays, corresponding to the past seven years. Of course it is not exactly 200 becauses the may be one tuesday where the market is closed (if christmas is on tuesday for instance)
Output:
Displays four daily averages as four lines with their levels as labels :
High and Low averages are displayed at the extremes.
Open and Close averages are displayed at the center.
Color coding:
Red indicates bearish movement.
Green indicates bullish movement.
Usage recommendations:
Best suited for assets with a significant historical dataset.
Only functional on daily timeframes.
開源腳本
秉持TradingView一貫精神,這個腳本的創作者將其設為開源,以便交易者檢視並驗證其功能。向作者致敬!您可以免費使用此腳本,但請注意,重新發佈代碼需遵守我們的社群規範。
免責聲明
這些資訊和出版物並非旨在提供,也不構成TradingView提供或認可的任何形式的財務、投資、交易或其他類型的建議或推薦。請閱讀使用條款以了解更多資訊。
免責聲明
這些資訊和出版物並非旨在提供,也不構成TradingView提供或認可的任何形式的財務、投資、交易或其他類型的建議或推薦。請閱讀使用條款以了解更多資訊。