OPEN-SOURCE SCRIPT
已更新 RSI with Close & Tail Divergences

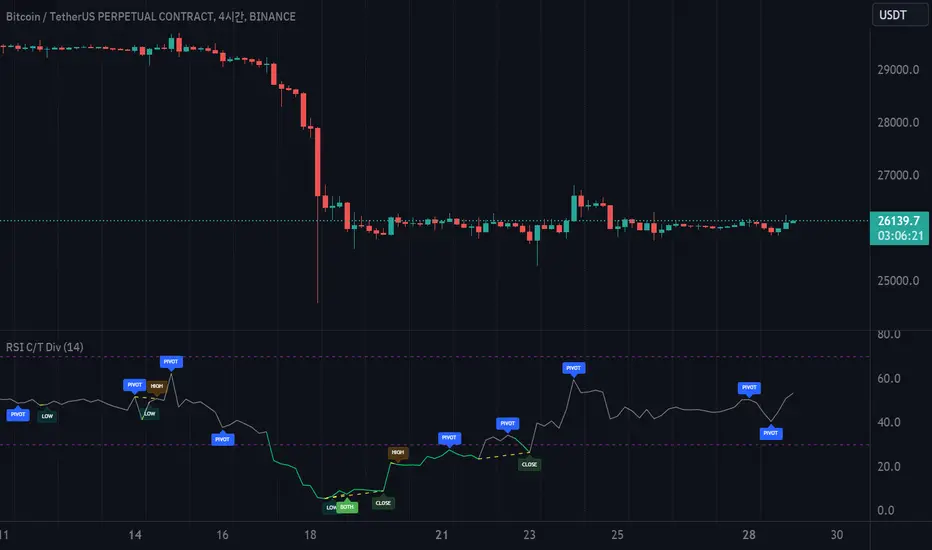
RSI divergence is a cornerstone signal for both stock and cryptocurrency traders, renowned for its reliability.
The basis for measuring divergence can vary:
Depending on the criteria selected, the resultant signals can be markedly different.
Our innovative indicator offers:
With this tool, traders are empowered to make informed decisions, anchored in precise divergence cues.
This indicator boasts the following capabilities:

The basis for measuring divergence can vary:
- Historically, it's been determined by the candlestick's closing price.
- However, a contemporary approach uses the tail values, specifically the high and low prices, of the candlestick.
Depending on the criteria selected, the resultant signals can be markedly different.
Our innovative indicator offers:
- Divergence tracking based on the closing price of the candlestick.
- Divergence tracking considering the candlestick's peak and trough values.
- A unique convergence of both types of divergence signals.
With this tool, traders are empowered to make informed decisions, anchored in precise divergence cues.
This indicator boasts the following capabilities:
- Displays divergence based on closing price, highs/lows, as well as a unique combined criterion.
- Highlights pivot points.
- Denotes divergence spots on the RSI chart with lines.
- Offers a background color representation instead of labels.
發行說明
RSI divergence is a cornerstone signal for both stock and cryptocurrency traders, renowned for its reliability.The basis for measuring divergence can vary:
- Historically, it's been determined by the candlestick's closing price.
- However, a contemporary approach uses the tail values, specifically the high and low prices, of the candlestick.
Depending on the criteria selected, the resultant signals can be markedly different.
Our innovative indicator offers:
- Divergence tracking based on the closing price of the candlestick.
- Divergence tracking considering the candlestick's peak and trough values.
- A unique convergence of both types of divergence signals.
With this tool, traders are empowered to make informed decisions, anchored in precise divergence cues.
This indicator boasts the following capabilities:
- Displays divergence based on closing price, highs/lows, as well as a unique combined criterion.
- Highlights pivot points.
- Denotes divergence spots on the RSI chart with lines.
- Offers a background color representation instead of labels.
開源腳本
秉持TradingView一貫精神,這個腳本的創作者將其設為開源,以便交易者檢視並驗證其功能。向作者致敬!您可以免費使用此腳本,但請注意,重新發佈代碼需遵守我們的社群規範。
免責聲明
這些資訊和出版物並非旨在提供,也不構成TradingView提供或認可的任何形式的財務、投資、交易或其他類型的建議或推薦。請閱讀使用條款以了解更多資訊。
開源腳本
秉持TradingView一貫精神,這個腳本的創作者將其設為開源,以便交易者檢視並驗證其功能。向作者致敬!您可以免費使用此腳本,但請注意,重新發佈代碼需遵守我們的社群規範。
免責聲明
這些資訊和出版物並非旨在提供,也不構成TradingView提供或認可的任何形式的財務、投資、交易或其他類型的建議或推薦。請閱讀使用條款以了解更多資訊。