OPEN-SOURCE SCRIPT
Short & Long Relative Strength
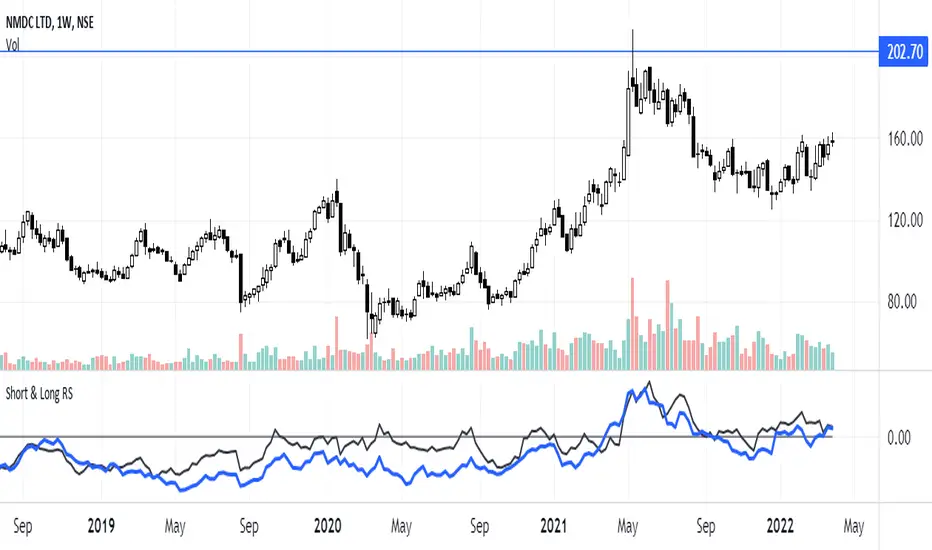
Relative Strength (RS) is a method of identifying stocks which are relatively stronger or weaker as compared the market as a whole or to a relevant benchmark.
To calculate the relative strength of a particular stock, divide the percentage change over some time period by the percentage change of a particular index over the same time period.
The value of RS Indicator oscillates around zero. If value of RS is above ZERO then security is outperforming the benchmark and if value of RS is below ZERO then security is outperforming the benchmark.
Here i have used two RS indicator lines in one indicator - Short Term RS (default value is 65) and Long Term RS (default value is 123).
I have set default benchmark index as Nifty 50 (NSE:NIFTY)
開源腳本
秉持TradingView一貫精神,這個腳本的創作者將其設為開源,以便交易者檢視並驗證其功能。向作者致敬!您可以免費使用此腳本,但請注意,重新發佈代碼需遵守我們的社群規範。
免責聲明
這些資訊和出版物並非旨在提供,也不構成TradingView提供或認可的任何形式的財務、投資、交易或其他類型的建議或推薦。請閱讀使用條款以了解更多資訊。
免責聲明
這些資訊和出版物並非旨在提供,也不構成TradingView提供或認可的任何形式的財務、投資、交易或其他類型的建議或推薦。請閱讀使用條款以了解更多資訊。