OPEN-SOURCE SCRIPT
TP Hunter [Sniper Trading System]
TP Hunter Overlay — Sniper Trading System Suite
What it is
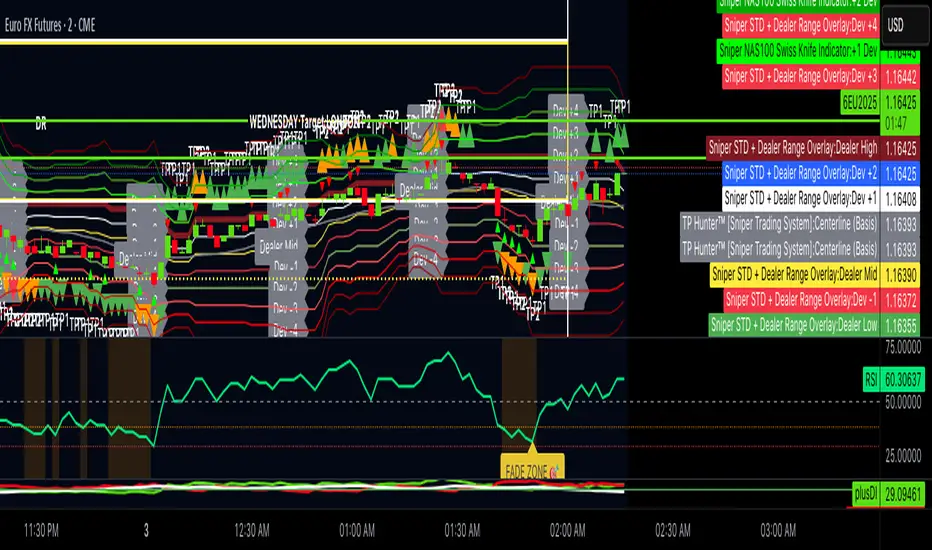
TP Hunter helps with the hardest part of trading: exits. It plots Take Profit zones (TP1/TP2/TP3) using a standard deviation model around a 20-period moving average (“Centerline”). When price reaches a target, TP Hunter marks it on the chart and can trigger an alert—so you can scale out with discipline.
How it works (plain language)
The Centerline is a 20-period SMA (average price).
The script measures recent volatility (standard deviation) and projects TP levels above/below the Centerline.
If price is above the Centerline, the script treats it as buy context; below = sell context.
When price touches a TP level in that context, the indicator prints a shape (TP1 green, TP2 orange, TP3 red) and alerts can fire.
Inputs
TP1/TP2/TP3 Multiplier: distance of each target from the Centerline (in standard deviations).
RSI Period / Levels: optional filter to avoid extreme conditions (default enabled).
Show TP Hit Labels: toggle the on-chart labels.
Visuals
Centerline (gray)
TP hits:
Buy hits = triangles above bars (TP1/TP2/TP3 = green/orange/red).
Sell hits = triangles below bars (TP1/TP2/TP3 = green/orange/red).
Alerts
TP1/TP2/TP3 hit alerts for both buy and sell contexts.
Suggested workflow: set alerts, scale out at TP1/TP2, reserve a runner for TP3.
Best practices
Use TP Hunter to plan exits after your own entry signal (e.g., time-based or liquidity-based entries).
If you want fewer but stronger targets, increase the multipliers.
If you want more frequent targets, decrease them slightly.
RSI filter can reduce noise during extreme momentum.
Notes & Limitations
This is an overlay tool for exit management, not a standalone entry system.
Shapes confirm on bar close; alerts can trigger intrabar when a level is touched.
No financial advice. Past performance does not guarantee future results.
What it is
TP Hunter helps with the hardest part of trading: exits. It plots Take Profit zones (TP1/TP2/TP3) using a standard deviation model around a 20-period moving average (“Centerline”). When price reaches a target, TP Hunter marks it on the chart and can trigger an alert—so you can scale out with discipline.
How it works (plain language)
The Centerline is a 20-period SMA (average price).
The script measures recent volatility (standard deviation) and projects TP levels above/below the Centerline.
If price is above the Centerline, the script treats it as buy context; below = sell context.
When price touches a TP level in that context, the indicator prints a shape (TP1 green, TP2 orange, TP3 red) and alerts can fire.
Inputs
TP1/TP2/TP3 Multiplier: distance of each target from the Centerline (in standard deviations).
RSI Period / Levels: optional filter to avoid extreme conditions (default enabled).
Show TP Hit Labels: toggle the on-chart labels.
Visuals
Centerline (gray)
TP hits:
Buy hits = triangles above bars (TP1/TP2/TP3 = green/orange/red).
Sell hits = triangles below bars (TP1/TP2/TP3 = green/orange/red).
Alerts
TP1/TP2/TP3 hit alerts for both buy and sell contexts.
Suggested workflow: set alerts, scale out at TP1/TP2, reserve a runner for TP3.
Best practices
Use TP Hunter to plan exits after your own entry signal (e.g., time-based or liquidity-based entries).
If you want fewer but stronger targets, increase the multipliers.
If you want more frequent targets, decrease them slightly.
RSI filter can reduce noise during extreme momentum.
Notes & Limitations
This is an overlay tool for exit management, not a standalone entry system.
Shapes confirm on bar close; alerts can trigger intrabar when a level is touched.
No financial advice. Past performance does not guarantee future results.
開源腳本
本著TradingView的真正精神,此腳本的創建者將其開源,以便交易者可以查看和驗證其功能。向作者致敬!雖然您可以免費使用它,但請記住,重新發佈程式碼必須遵守我們的網站規則。
免責聲明
這些資訊和出版物並不意味著也不構成TradingView提供或認可的金融、投資、交易或其他類型的意見或建議。請在使用條款閱讀更多資訊。
開源腳本
本著TradingView的真正精神,此腳本的創建者將其開源,以便交易者可以查看和驗證其功能。向作者致敬!雖然您可以免費使用它,但請記住,重新發佈程式碼必須遵守我們的網站規則。
免責聲明
這些資訊和出版物並不意味著也不構成TradingView提供或認可的金融、投資、交易或其他類型的意見或建議。請在使用條款閱讀更多資訊。