OPEN-SOURCE SCRIPT
Market Structure - HH, HL, LH, LL with Trendlines & Alerts
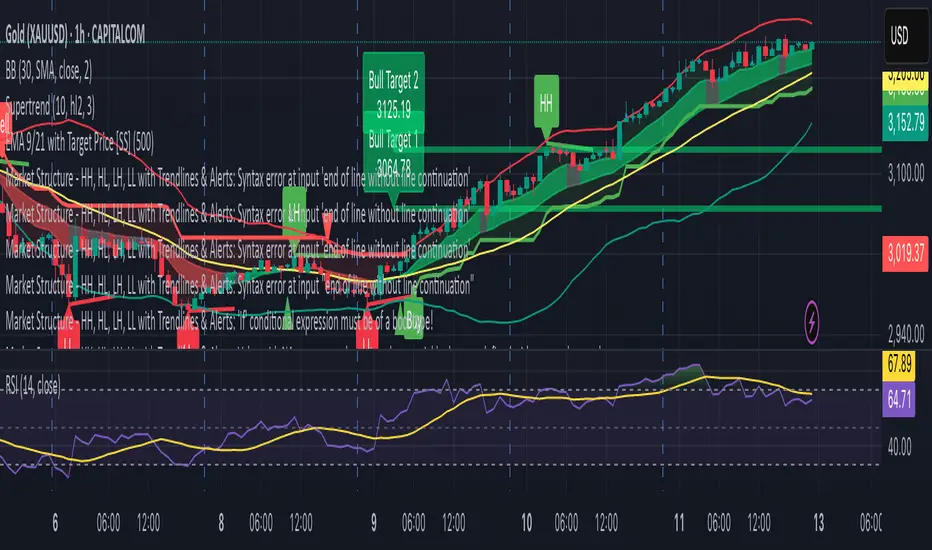
Market Structure Script – HH, HL, LH, LL with Trendlines & Alerts
This Pine Script is designed to help identify key market structure patterns such as Higher Highs (HH), Higher Lows (HL), Lower Highs (LH), and Lower Lows (LL) on price charts. It also draws trendlines connecting the respective swing points and provides alerts when these important price patterns occur.
Key Features:
Swing High and Low Detection:
The script uses the ta.pivothigh and ta.pivotlow functions to identify significant swing highs and swing lows based on the pivot length (pivotLen). These points mark local peaks and troughs in the price action.
Dynamic Pivot Length:
The script adjusts the pivotLen (which defines the number of bars used to calculate swing points) based on the current timeframe of the chart. For example, for a 15-minute chart, it uses a pivot length of 5 bars, while for a daily chart, it uses 10 bars. This dynamic adjustment ensures that the script works across different timeframes.
Higher Highs (HH), Higher Lows (HL), Lower Highs (LH), Lower Lows (LL):
Higher High (HH): Identifies a price peak that is higher than the previous swing high, indicating an uptrend.
Higher Low (HL): Identifies a price trough that is higher than the previous swing low, supporting the idea of an ongoing uptrend.
Lower High (LH): Identifies a price peak that is lower than the previous swing high, suggesting a potential reversal or downtrend.
Lower Low (LL): Identifies a price trough that is lower than the previous swing low, indicating a downtrend.
Trendlines:
For each identified Higher High, Higher Low, Lower High, or Lower Low, the script automatically draws a trendline connecting the corresponding swing points. These trendlines provide a visual representation of the market’s price structure, showing support and resistance levels.
Labels:
The script places labels on the chart next to the respective swing points. These labels mark whether the point is a Higher High (HH), Higher Low (HL), Lower High (LH), or Lower Low (LL). This helps traders easily visualize the price pattern at a glance.
Alerts:
Alert conditions are set for when a Higher High (HH), Higher Low (HL), Lower High (LH), or Lower Low (LL) is detected. Users can set up alerts to be notified whenever one of these key market structure patterns forms. Alerts are an essential feature for traders who want to act quickly when important trend changes are happening.
開源腳本
秉持TradingView一貫精神,這個腳本的創作者將其設為開源,以便交易者檢視並驗證其功能。向作者致敬!您可以免費使用此腳本,但請注意,重新發佈代碼需遵守我們的社群規範。
免責聲明
這些資訊和出版物並非旨在提供,也不構成TradingView提供或認可的任何形式的財務、投資、交易或其他類型的建議或推薦。請閱讀使用條款以了解更多資訊。
免責聲明
這些資訊和出版物並非旨在提供,也不構成TradingView提供或認可的任何形式的財務、投資、交易或其他類型的建議或推薦。請閱讀使用條款以了解更多資訊。