OPEN-SOURCE SCRIPT
已更新 StochCMO - Stochastic CMO [SHK]
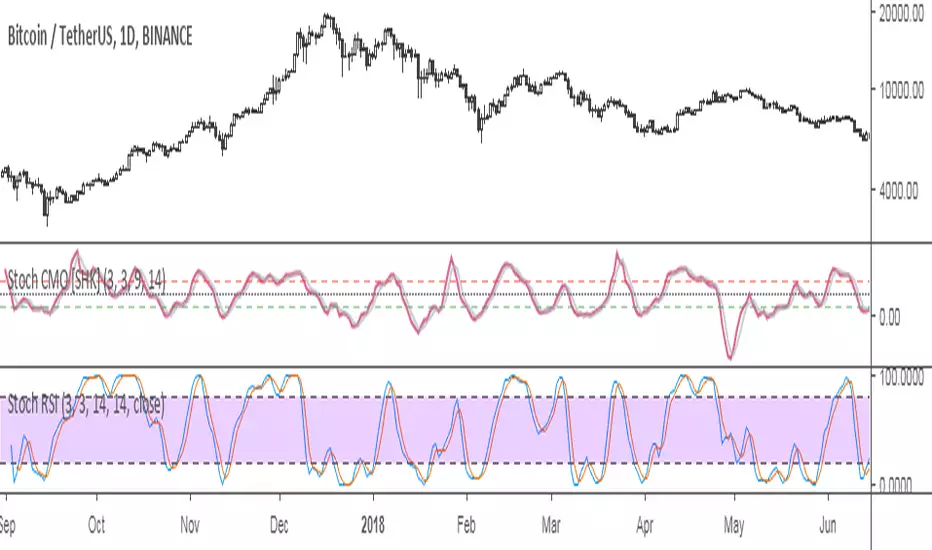
StochCMO is the combination of Stochastic and CMO (Chande Momentum Oscillator).
The StochCMO is an indicator used in technical analysis that ranges between zero and one and is created by applying the Stochastic Oscillator formula to a set of Chande Momentum Oscillator (CMO) values rather than standard price data. Using CMO values within the Stochastic formula gives traders an idea of whether the current CMO value is overbought or oversold - a measure that becomes specifically useful when the CMO value is confined between its signal levels of 20 and 80.
Usage:
The usage of StochCMO is similar to StochRSI.
StochCMO vs StochRSI:
The difference between these indicators can be realized by comparing CMO & RSI:
CMO is similar to the Relative Strength Index (RSI) except that it measures momentum on both up days and down days. The CMO also does not use internal smoothing and thus does not obscure short-term extremes in momentum. As a result, the CMO often reaches over bought and over sold areas more regularly than momentum indicators, such as the RSI, that have internal smoothing.
Hope it helps you.
發行說明
New Source Code開源腳本
秉持TradingView一貫精神,這個腳本的創作者將其設為開源,以便交易者檢視並驗證其功能。向作者致敬!您可以免費使用此腳本,但請注意,重新發佈代碼需遵守我們的社群規範。
免責聲明
這些資訊和出版物並非旨在提供,也不構成TradingView提供或認可的任何形式的財務、投資、交易或其他類型的建議或推薦。請閱讀使用條款以了解更多資訊。
免責聲明
這些資訊和出版物並非旨在提供,也不構成TradingView提供或認可的任何形式的財務、投資、交易或其他類型的建議或推薦。請閱讀使用條款以了解更多資訊。