OPEN-SOURCE SCRIPT
已更新 Krugman's Dynamic DCA

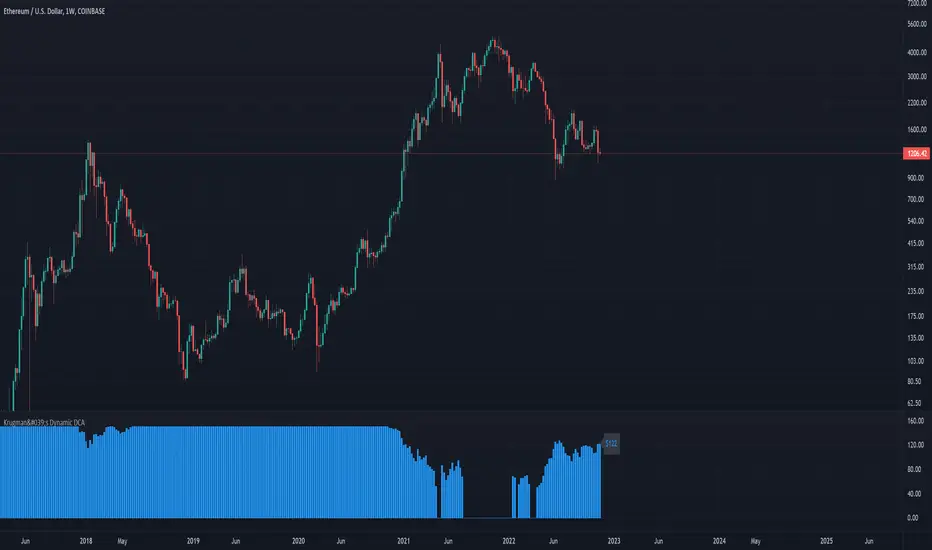
This script helps you create a DCA (dollar-cost averaging) strategy for your favorite markets and calculates the DCA value for each bar. This can be used to DCA daily, weekly, bi-weekly, etc.
Configuring the indicator:
-DCA Starting Price: the price you want to begin DCA'ing
-DCA Base Amount: the $ amount you will DCA when price is half of your starting price
-DCA Max Amount: the maximum amount you want to DCA regardless of how low price gets
The DCA scaling works exactly like the formula used to calculated the gain needed to recover from a given % loss. In this case it's calculated from the DCA Starting Price. The idea is to increase the DCA amount linearly with the increased upside potential.
發行說明
*Updated panel name發行說明
Added a minimum DCA amount to allow users to avoid extremely small DCA buys when the price is close to the dcaStartingPrice. Your DCA will never be smaller than this value as long as price is below the dcaStartingPrice.發行說明
I've updated the DCA model to use a more simple linear pricing method. It still works very similar to the previous pricing method whereDCA Starting Price = Market price to begin DCA'ing
DCA Plateau Price = Market price where DCA amount stops increasing (i.e. when the DCA amount "plateaus")
DCA Min Amount/b] = The DCA amount when price initially crosses below the starting price
DCA Max Amount/b] = The DCA amount when price reaches or drops below the plateau price. The DCA amount will not increase beyond this value regardless of how far market price goes below the plateau price.
發行說明
Added decimals to script variables to allow for DCA coins that are sub $1.發行說明
Publishing script to update the chart開源腳本
本著TradingView的真正精神,此腳本的創建者將其開源,以便交易者可以查看和驗證其功能。向作者致敬!雖然您可以免費使用它,但請記住,重新發佈程式碼必須遵守我們的網站規則。
Dad of 5 • Dev • Candlestick Whisperer • Crypto class of 2019
免責聲明
這些資訊和出版物並不意味著也不構成TradingView提供或認可的金融、投資、交易或其他類型的意見或建議。請在使用條款閱讀更多資訊。
開源腳本
本著TradingView的真正精神,此腳本的創建者將其開源,以便交易者可以查看和驗證其功能。向作者致敬!雖然您可以免費使用它,但請記住,重新發佈程式碼必須遵守我們的網站規則。
Dad of 5 • Dev • Candlestick Whisperer • Crypto class of 2019
免責聲明
這些資訊和出版物並不意味著也不構成TradingView提供或認可的金融、投資、交易或其他類型的意見或建議。請在使用條款閱讀更多資訊。