Greer Free Cash Flow Yield✅ Title
Greer Free Cash Flow Yield (FCF%) — Long-Term Value Signal
📝 Description
The Greer Free Cash Flow Yield indicator is part of the Greer Financial Toolkit, designed to help long-term investors identify fundamentally strong and potentially undervalued companies.
📊 What It Does
Calculates Free Cash Flow Per Share (FY) from official financial reports
Divides by the current stock price to produce Free Cash Flow Yield %
Tracks a static average across all available financial years
Color-codes the yield line:
🟩 Green when above average (stronger value signal)
🟥 Red when below average (weaker value signal)
💼 Why It Matters
FCF Yield is a powerful metric that reveals how efficiently a company turns revenue into usable cash. This can be a better long-term value indicator than earnings yield or P/E ratios, especially in capital-intensive industries.
✅ Best used in combination with:
📘 Greer Value (fundamental growth score)
🟢 Greer BuyZone (technical buy zone detection)
🔍 Designed for:
Fundamental investors
Value screeners
Dividend and FCF-focused strategies
📌 This tool is for informational and educational use only. Always do your own research before investing.
Longterm

S&P 500 & Normalized CAPE Z-Score AnalyzerThis macro-focused indicator visualizes the historical valuation of the U.S. equity market using the CAPE ratio (Shiller P/E), normalized over its long-term average and standard deviations. It helps traders and investors identify overvaluation and undervaluation zones over time, combining both statistical signals and historical context.
💡 Why It’s Useful
This indicator is ideal for macro traders and long-term investors looking to contextualize equity valuations across decades. It helps identify statistical extremes in valuation by referencing the standard deviation of the CAPE ratio relative to its long-term mean. The overlay of S&P 500 price with valuation zones provides a visual confirmation tool for macro decisions or timing insights.
It includes:
✅ Three display modes:
-S&P 500 (color-coded by CAPE valuation zone)
-Normalized CAPE (vs. long-term mean)
-CAPE Z-Score (standardized measure)
🎯 How to Interpret
Dynamic coloring of the S&P 500 price based on CAPE valuation:
🔴 Z > +2σ → Highly Overvalued
🟠 Z > +1σ → Overvalued
⚪ -1σ < Z < +1σ → Neutral
🟢 Z < -1σ → Undervalued
✅ Z < -2σ → Strong Buy Zone
-Live valuation label showing the current CAPE, Z-score, and zone.
-Macro event shading: major historical events (e.g. Great Depression, Oil Crisis, Dot-com Bubble, COVID Crash) are shaded on the chart for context.
✅ Built-in alerts:
CAPE > +2σ → Potential risk zone
CAPE < -2σ → Potential opportunity zone
📊 Use Cases
This indicator is ideal for:
🧠 Macro traders seeking long-term valuation extremes.
📈 Portfolio managers monitoring systemic valuation risk.
🏛️ Long-term investors timing strategic allocation shifts.
🧪 How It Works
CAPE ratio (Shiller PE) is retrieved from Quandl (MULTPL/SHILLER_PE_RATIO_MONTH).
The script calculates the long-term average and standard deviation of CAPE.
The Z-score is computed as:
(CAPE - Mean) / Standard Deviation
Users can switch between:
S&P 500 chart, color-coded by CAPE valuation zones.
Normalized CAPE, centered around zero (historic mean).
CAPE Z-score, showing statistical positioning directly.
Visual bands represent +1σ, +2σ, -1σ, -2σ thresholds.
You can switch between modes using the “Display” dropdown in the settings panel.
📊 Data Sources
CAPE: MULTPL/SHILLER_PE_RATIO_MONTH via Quandl
S&P 500: Monthly close prices of SPX (TradingView data)
All data updated on monthly resolution
This is not a repackaged built-in or autogenerated script. It’s a custom-built and interactive indicator designed for educational and analytical use in macroeconomic valuation studies.

Modern Economic Eras DashboardOverview
This script provides a historical macroeconomic visualization of U.S. markets, highlighting long-term structural "eras" such as the Bretton Woods period, the inflationary 1970s, and the post-2020 "Age of Disorder." It overlays key economic indicators sourced from FRED (Federal Reserve Economic Data) and displays notable market crashes, all in a clean and rescaled format for easy comparison.
Data Sources & Indicators
All data is loaded monthly from official FRED series and rescaled to improve readability:
🔵 Real GDP (FRED:GDP): Total output of the U.S. economy.
🔴 Inflation Index (FRED:CPIAUCSL): Consumer price index as a proxy for inflation.
⚪ Debt to GDP (FRED:GFDGDPA188S): Federal debt as % of GDP.
🟣 Labor Force Participation (FRED:CIVPART): % of population in the labor force.
🟠 Oil Prices (FRED:DCOILWTICO): Monthly WTI crude oil prices.
🟡 10Y Real Yield (FRED:DFII10): Inflation-adjusted yield on 10-year Treasuries.
🔵 Symbol Price: Optionally overlays the charted asset’s price, rescaled.
Historical Crashes
The dashboard highlights 10 major U.S. market crashes, including 1929, 2000, and 2008, with labeled time spans for quick context.
Era Classification
Six macroeconomic eras based on Deutsche Bank’s Long-Term Asset Return Study (2020) are shaded with background color. Each era reflects dominant economic regimes—globalization, wars, monetary systems, inflationary cycles, and current geopolitical disorder.
Best Use Cases
✅ Long-term macro investors studying structural market behavior
✅ Educators and analysts explaining economic transitions
✅ Portfolio managers aligning strategy with macroeconomic phases
✅ Traders using history for cycle timing and risk assessment
Technical Notes
Designed for monthly timeframe, though it works on weekly.
Uses close price and standard request.security calls for consistency.
Max labels/lines configured for broader history (from 1860s to present).
All plotted series are rescaled manually for better visibility.
Originality
This indicator is original and not derived from built-in or boilerplate code. It combines multiple economic dimensions and market history into one interactive chart, helping users frame today's markets in a broader structural context.

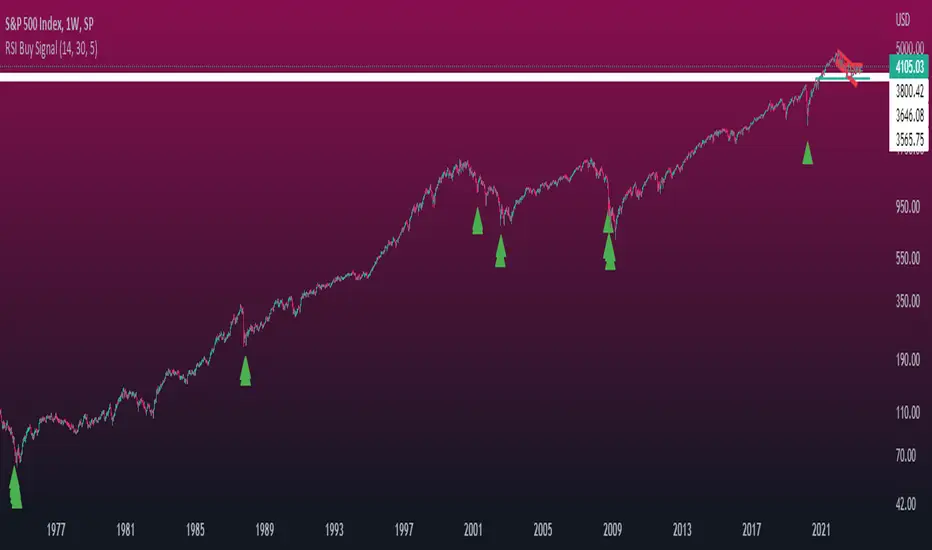
Long and Short Term Highs and LowsLong and Short Term Highs and Lows
Overview:
This indicator is designed to help traders identify significant price points by marking new highs and lows over two distinct timeframes—a long-term and a short-term period. It achieves this by drawing optional channel lines that outline the highest highs and lowest lows over the chosen time periods and by plotting visual markers (triangles) on the chart when a new high or low is detected.
Key Features:
Dual Timeframe Analysis:
Long Term: Uses a user-defined “Time Period” (default 52) and “Time Unit” (default: Weekly) to determine long-term high and low levels.
Short Term: Uses a separate “Time Period” (default 50) and “Time Unit” (default: Daily) to compute short-term high and low levels.
Optional Channel Display:
For both long and short term periods, you have the option to display a channel by plotting the highest and lowest values as lines. This visual channel helps to delineate the range within which the price has traded over the selected period.
New High/Low Markers:
The indicator identifies moments when the highest high or lowest low is updated relative to the previous bar.
When a new high is established, an up triangle is plotted above the bar.
Conversely, when a new low occurs, a down triangle is plotted below the bar.
Separate input toggles allow you to enable or disable these markers independently for the long-term and short-term setups.
Inputs and Settings:
Long Term High/Low Period Settings:
Show New High/Low? (STW): Toggle to enable or disable the plotting of new high/low markers for the long-term period.
Time Period: The number of bars used to calculate the highest high and lowest low (default is 52).
Time Unit: The timeframe on which the long-term calculation is based (default is Weekly).
Show Channel? (SCW): Toggle to display the channel lines that connect the long-term high and low levels.
Short Term High/Low Period Settings:
Show New High/Low?: Toggle to enable or disable the plotting of new high/low markers for the short-term period.
Time Period: The number of bars used for calculating the short-term extremes (default is 50).
Time Unit: The timeframe on which the short-term calculations are based (default is Daily).
Show Channel?: Toggle to display the channel lines for the short-term highs and lows.
Indicator Logic:
Channel Calculation:
The script uses the request.security function to pull data from the specified timeframes. For each timeframe:
It calculates the lowest low over the defined period using ta.lowest.
It calculates the highest high over the defined period using ta.highest.
These values can be optionally plotted as channel lines when the “Show Channel?” option is enabled.
New High/Low Detection:
For each timeframe, the indicator compares the current high (or low) with its immediate previous value:
New High: When the current high exceeds the previous bar’s high, an up triangle is drawn above the bar.
New Low: When the current low falls below the previous bar’s low, a down triangle is drawn below the bar.
Usage and Interpretation:
Trend Identification:
When new highs (or lows) occur, they can signal the start of a strong upward (or downward) movement. The indicator helps you visually track these critical turning points over both longer and shorter periods.
Channel Breakouts:
The optional channel display offers additional context. Price movement beyond these channels may indicate a breakout or a significant shift in trend.
Customizable Timeframes:
You can adjust both the time period and time unit to fit your trading style—whether you’re focusing on longer-term trends or short-term price action.
Conclusion:
This indicator provides a dual-layer analysis by combining long-term and short-term perspectives, making it a versatile tool for identifying key highs and lows. Whether you are looking to confirm trend strength or spot potential breakouts, the “Long and Short Term Highs and Lows” indicator adds a valuable visual element to your TradingView charts.

3x Supertrend (for Vietnamese stock market and vn30f1m)The 4Vietnamese 3x Supertrend Strategy is an advanced trend-following trading system developed in Pine Script™ and designed for publication on TradingView as an open-source strategy under the Mozilla Public License 2.0. This strategy leverages three Supertrend indicators with different ATR lengths and multipliers to identify optimal trade entries and exits while dynamically managing risk.
Key Features:
Option to build and hold long term positions with entry stop order. Try this to avoid market complex movement and retain long term investment style's benefits.
Advanced Entry & Exit Optimization: Includes configurable stop-loss mechanisms, pyramiding, and exit conditions tailored for different market scenarios.
Dynamic Risk Management: Implements features like selective stop-loss activation, trade window settings, and closing conditions based on trend reversals and loss management.
This strategy is particularly suited for traders seeking a systematic and rule-based approach to trend trading. By making it open-source, we aim to provide transparency, encourage community collaboration, and help traders refine and optimize their strategies for better performance.
License:
This script is released under the Mozilla Public License 2.0, allowing modifications and redistribution while maintaining open-source integrity.
Happy trading!

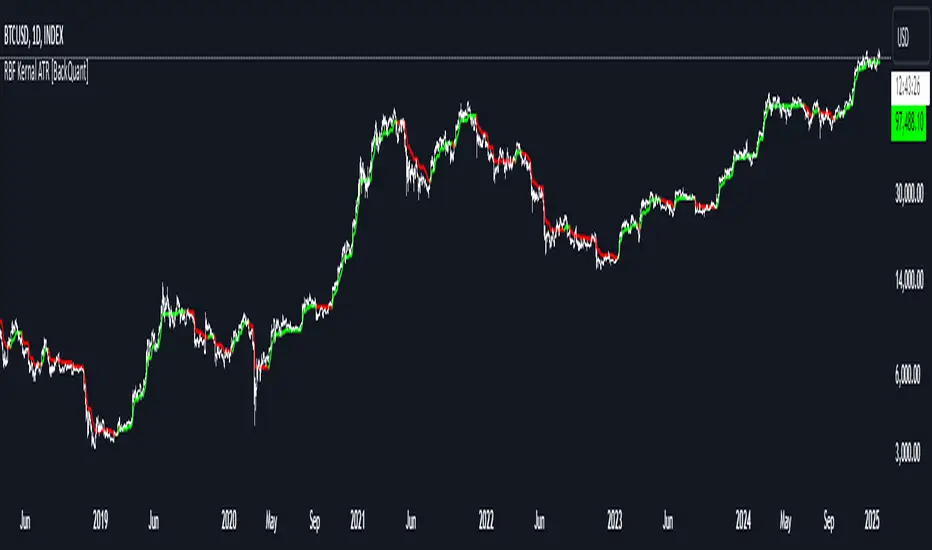
Radial Basis Kernal ATR [BackQuant]Radial Basis Kernel ATR
The Radial Basis Kernel ATR is a trading indicator that combines the classic Average True Range (ATR) with advanced Radial Basis Function (RBF) kernel smoothing . This innovative approach creates a highly adaptive and precise tool for detecting volatility, identifying trends, and providing dynamic support and resistance levels.
With its configurable parameters and ability to adjust to market conditions, this indicator offers traders a robust framework for making informed decisions across various assets and timeframes.
Key Feature: Radial Basis Function Kernel Smoothing
The Radial Basis Function (RBF) kernel is at the heart of this indicator, applying sophisticated mathematical techniques to smooth price data and calculate an enhanced version of ATR. By weighting data points dynamically, the RBF kernel ensures that recent price movements are given appropriate emphasis without overreacting to short-term noise.
The RBF kernel uses a gamma factor to control the degree of smoothing, making it highly adaptable to different asset classes and market conditions:
Gamma Factor Adjustment :
For low-volatility data (e.g., indices), a smaller gamma (0.05–0.1) ensures smoother trends and avoids overly sharp responses.
For high-volatility data (e.g., cryptocurrencies), a larger gamma (0.1–0.2) captures the increased price fluctuations while maintaining stability.
Experimentation is Key : Traders are encouraged to backtest and visually compare different gamma values to find the optimal setting for their specific asset and strategy.
The gamma factor dynamically adjusts based on the variance of the source data, ensuring the indicator remains effective across a wide range of market conditions.
Average True Range (ATR) with Dynamic Bands
The ATR is a widely used volatility measure that captures the degree of price movement over a specific period. This indicator enhances the traditional ATR by integrating the RBF kernel, resulting in a smoothed and adaptive ATR calculation.
Dynamic bands are created around the RBF kernel output using a user-defined ATR factor , offering valuable insights into potential support and resistance zones. These bands expand and contract based on market volatility, providing a visual representation of potential price movement.
Moving Average Confluence
For additional confirmation, the indicator includes the option to overlay a moving average on the smoothed ATR. Traders can choose from several moving average types, such as EMA , SMA , or Hull , and adjust the lookback period to suit their strategy. This feature helps identify broader trends and potential confluence areas, making the indicator even more versatile.
Long and Short Trend Detection
The indicator provides long and short signals based on the directional movement of the smoothed ATR:
Long Signal : Triggered when the ATR crosses above its previous value, indicating bullish momentum.
Short Signal : Triggered when the ATR crosses below its previous value, signaling bearish momentum.
These trend signals are visually highlighted on the chart with green and red bar coloring (optional), providing clear and actionable insights.
Customization Options
The Radial Basis Kernel ATR offers extensive customization options, allowing traders to tailor the indicator to their preferences:
RBF Kernel Settings
Source : Select the price data (e.g., close, high, low) used for the kernel calculation.
Kernel Length : Define the lookback period for the RBF kernel, controlling the smoothing effect.
Gamma Factor : Adjust the smoothing sensitivity, with smaller values for smoother trends and larger values for responsiveness.
ATR Settings
ATR Period : Set the period for ATR calculation, with shorter periods capturing more short-term volatility and longer periods providing a broader view.
ATR Factor : Adjust the scaling of ATR bands for dynamic support and resistance levels.
Confluence Settings
Moving Average Type : Choose from various moving average types for additional trend confirmation.
Moving Average Period : Define the lookback period for the moving average overlay.
Visualization
Trend Coloring : Enable or disable bar coloring based on trend direction (green for long, red for short).
Background Highlighting : Add optional background shading to emphasize long and short trends visually.
Line Width : Customize the thickness of the plotted ATR line for better visibility.
Alerts and Automation
To help traders stay on top of market movements, the indicator includes built-in alerts for trend changes:
Kernel ATR Trend Up : Triggered when the ATR indicates a bullish trend.
Kernel ATR Trend Down : Triggered when the ATR signals a bearish trend.
These alerts ensure traders never miss important opportunities, providing timely notifications directly to their preferred device.
Suggested Gamma Values
The effectiveness of the gamma factor depends on the asset type and the selected kernel length:
Low Volatility Assets (e.g., indices): Use a smaller gamma factor (approximately 0.05–0.1) for smoother trends.
High Volatility Assets (e.g., crypto): Use a larger gamma factor (approximately 0.1–0.2) to capture sharper price movements.
Experimentation : Fine-tune the gamma factor using backtests or visual comparisons to optimize for specific assets and strategies.
Trading Applications
The Radial Basis Kernel ATR is a versatile tool suitable for various trading styles and strategies:
Trend Following : Use the smoothed ATR and dynamic bands to identify and follow trends with confidence.
Reversal Trading : Spot potential reversals by observing interactions with dynamic ATR bands and moving average confluence.
Volatility Analysis : Analyze market volatility to adjust risk management strategies or position sizing.
Final Thoughts
The Radial Basis Kernel ATR combines advanced mathematical techniques with the practical utility of ATR, offering traders a powerful and adaptive tool for volatility analysis and trend detection. Its ability to dynamically adjust to market conditions through the RBF kernel and gamma factor makes it a unique and indispensable part of any trader's toolkit.
By combining sophisticated smoothing , dynamic bands , and customizable visualization , this indicator enhances the ability to read market conditions and make more informed trading decisions. As always, backtesting and incorporating it into a broader strategy are recommended for optimal results.
Johnny's Adjusted BB Buy/Sell Signal"Johnny's Adjusted BB Buy/Sell Signal" leverages Bollinger Bands and moving averages to provide dynamic buy and sell signals based on market conditions. This indicator is particularly useful for traders looking to identify strategic entry and exit points based on volatility and trend analysis.
How It Works
Bollinger Bands Setup: The indicator calculates Bollinger Bands using a specified length and multiplier. These bands serve to identify potential overbought (upper band) or oversold (lower band) conditions.
Moving Averages: Two moving averages are calculated — a trend moving average (trendMA) and a long-term moving average (longTermMA) — to gauge the market's direction over different time frames.
Market Phase Determination: The script classifies the market into bullish or bearish phases based on the relationship of the closing price to the long-term moving average.
Strong Buy and Sell Signals: Enhanced signals are generated based on how significantly the price deviates from the Bollinger Bands, coupled with the average candle size over a specified lookback period. The signals are adjusted based on whether the market is bullish or bearish:
In bullish markets, a strong buy signal is triggered if the price significantly drops below the lower Bollinger Band. Conversely, a strong sell signal is activated when the price rises well above the upper band.
In bearish markets, these signals are modified to be more conservative, adjusting the thresholds for triggering strong buy and sell signals.
Features:
Flexibility: Users can adjust the length of the Bollinger Bands and moving averages, as well as the multipliers and factors that determine the strength of buy and sell signals, making it highly customizable to different trading styles and market conditions.
Visual Aids: The script vividly plots the Bollinger Bands and moving averages, and signals are visually represented on the chart, allowing traders to quickly assess trading opportunities:
Regular buy and sell signals are indicated by simple shapes below or above price bars.
Strong buy and sell signals are highlighted with distinctive colors and placed prominently to catch the trader's attention.
Background Coloring: The background color changes based on the market phase, providing an immediate visual cue of the market's overall sentiment.
Usage:
This indicator is ideal for traders who rely on technical analysis to guide their trading decisions. By integrating both Bollinger Bands and moving averages, it provides a multi-faceted view of market trends and volatility, making it suitable for identifying potential reversals and continuation patterns. Traders can use this tool to enhance their understanding of market dynamics and refine their trading strategies accordingly.

Buy Below Prev_Low. Sell 100% Above Avg. Pyramiding.This is simple indicator script for long term investors. It will check if the low of today is less than low of yesterday (or any time frame candle) and if the condition is satisfied, then the alert will be triggerred and that particular stock will be bought.
Each time a unit is bought, the average price is calculated and also the trget selling price, which is set at 100% above the average buying price. So once the price reaches that selling price target, the entire holding is sold.
The code resets all the variables back to 0 once a sell signal is triggerred.

Fetch Buy And Hold StrategyThis script was created as an experiment using ChatGPT. I actually woudn't recommend using the ai program to help you with your Pinescripts, as it makes a fair amount of mistakes. It was a fun experiment however.
The script is a simple buy and hold tool. Here's what it does:
- Everytime the rsi enters below the set treshold, a counter increases.
- The second increase of the counter happens when the price goes above the treshold, and then dips below the treshold again.
- The program would fire off a buy signal when the counter hits the number 3.
- After the buy. the counter will reset.
Lets take a look at the following example where the rsi treshold is 30:
- So the rsi dips below 30 and the initial counter is set from 0 to 1.
- The price rises which brings the rsi back to 40.
- Then another dip happens and the rsi is now 25, increasing the counter from 1 two.
- Rsi now dips to 23 and nothing happens.
- Rsi goes back up to 31, and dips back to 28 which puts the counter at 3. A buy singal is now fired and the counter is set to 0.
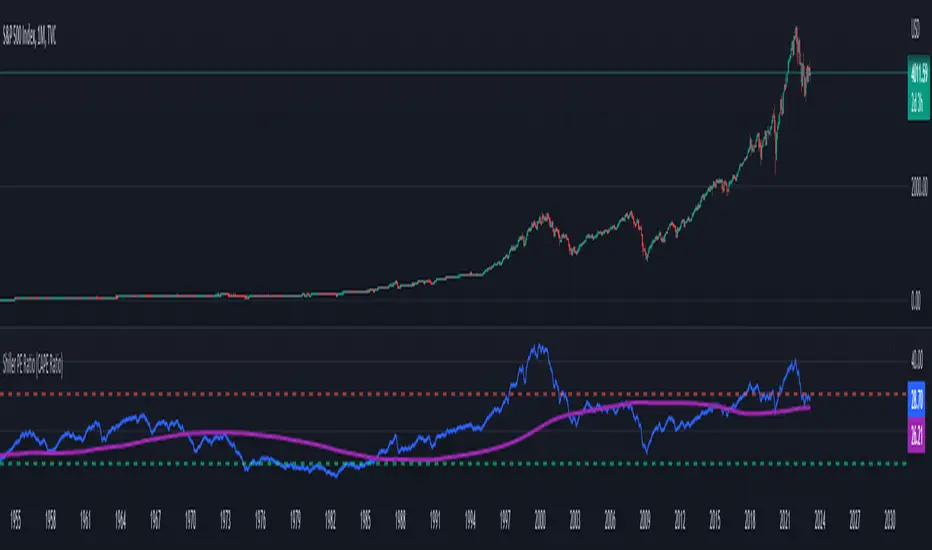
Shiller PE Ratio (CAPE Ratio) [WhaleCrew]Our Implementation of the famous Shiller PE Ratio (aka C yclically A djusted P rice-to- E arnings Ratio) a long-term valuation indicator for the S&P 500.
Calculation: Share price divided by 10 - year average, inflation - adjusted earnings
The indicator works on the M and 12M timeframe and has a built-in moving average that supports an upper and lower bollinger band.
Pivot Highs&lows: Short/Medium/Long-term + Spikeyness FilterShows Pivot Highs & Lows defined or 'Graded' on a fractal basis: Short-term, medium-term and long-term. Also applies 'Spikeyness' condition by default to filter-out weak/rounded pivots
ES1! 4hr chart (CME) shown above, with lookback = 15; clearly identifying the major highs & lows on the basis of how they are fractally 'nested' within lesser Pivots.
-- in the above chart Short term pivot highs (STH) are simply represented by green 'ʌ', and short-term pivot lows (STL) are simply represented by orange 'v'.
//Basics: (as applying to pivot highs, the following is reversed for pivot lows)
-Short term highs (STH) are simple pivot highs, albeit refined from standard with the 'spikeyness' filter.
-Medium-term highs (MTH) are defined as having a lower STH on either side of them.
-Long-term highs (LTH) are defined as having a lower MTH on either side of them.
//Purpose:
-Education: Quick and easy visualization of the strength or importance of a pivot high or low; a way of grading them based on their larger context.
-Backtesting: use in combination with other trading methods when backtesting to see the relative significance and price sensitivity of LTHs/LTLs compared to lower grade highs and lows.
//Settings:
-Choose Pivot lookback/lookforward bars: One setting, the basis from which all further pivot calculations are done.
-Toggle on/off 'Spikeyness' condition to filter-out weak/rounded/unimpressive pivot highs or lows (default is ON).
-Toggle on/off each of STH, MTH, LTH, STL, MTL, LTL; and choose label text-styles/colors/sizes independently.
-Set text Vertically, horizonally, or simply use 'ʌ' or 'v' symbols if you want to declutter your chart.
//Usage notes:
-Pivots take time to print (lookback bars must have elapsed before confirmation). Fractally nested pivots as here (i.e. a LTH), take even longer to print/confirm, so please be patient.
-Works across timeframes & Assets. Different timeframes may require slightly tweaked lookback/forward settings for optimal use; default is 15 bars.
Example usage with just symbolic labels short-term, med-term, long-term with 1x, 2x and 3x ʌ/v respectively:

Invest-Long : Script for quick checks before investingA simple script to verify RSI, SMAs, VWMA, and Pivots on Daily, Weekly, and Monthly time frames.
In case if you are not interested in SMA's or want to add different cheks -- simply copy the script to local and edit.
Happy investing.
Add the script to any chart and table values remain the same irrespective of current chart resolution, as it checks on Daily, Weekly, and Monthly time frames.
The table has multiple columns.
1st column checks on RSI value on all 3 timeframes. Ideally, look for all green and D>W>M
2nd Column: Check current Close is above 20 SMA and 50 SMA on Daily / Weekly / Monthly time frames
3rd Column: Check SMA 13> SMA 34, SMA 34 > SMA 55 and SMA 20 > SMA 50 on Daily / Weekly time frames
4th Column: Check Current close is above Weekly Pivot and Monthly Pivot. And also verify Close is above 4 Week High.
5th Column: Verify Close is above Daily VWMA. Also Daily VWMA is > Weekly VWMA and Weekly > Monthly.
// Similarly you can add more checks based on different time frames
Feel free to trouble me incase if need help.

Balance of Power Heikin Ashi Investing Strategy Balance of Power Heikin Ashi Investing Strategy
This is a swing strategy designed for investment help.
Its made around the Balace of Power indicator, but has been adapted on using the Monthly Heikin Ashi candle from the SPY asset in order to be used with correlation for US Stock/ETF/Index Markets.
The BOP acts as an oscilallator showing the power of a bull trend when its positive and a bearish trend when its in negative. At the same time we can spot reversals, based on the percentiles ( 99/1)
The rules for entry :
For long : The 99 percentile is ascending, and we are either in a positive value (>0), or we crossed the bottom place ( -0.35)
For short : the 99 and 1 percentile are descending, and we are either in a negative value(<0), or we crossed down the top place ( 0.6)
If you have any questions please let me know !

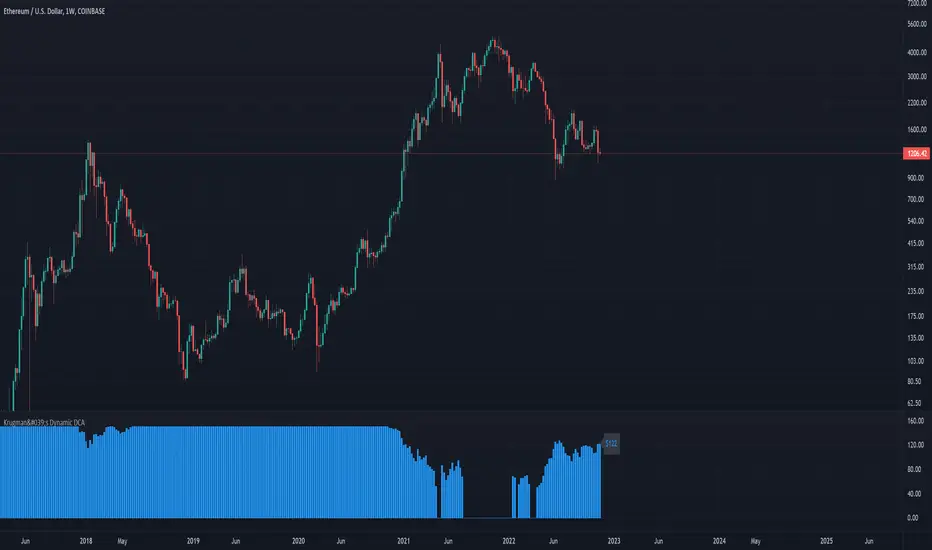
Krugman's Dynamic DCAThis script helps you create a DCA (dollar-cost averaging) strategy for your favorite markets and calculates the DCA value for each bar. This can be used to DCA daily, weekly, bi-weekly, etc.
Configuring the indicator:
- DCA Starting Price : the price you want to begin DCA'ing
- DCA Base Amount : the $ amount you will DCA when price is half of your starting price
- DCA Max Amount : the maximum amount you want to DCA regardless of how low price gets
The DCA scaling works exactly like the formula used to calculated the gain needed to recover from a given % loss. In this case it's calculated from the DCA Starting Price . The idea is to increase the DCA amount linearly with the increased upside potential.
Buffett Indicator: Wilshire 5000 to GDP Ratio [WhaleCrew]Our Implementation of the famous Buffett Indicator a long-term valuation indicator for stocks.
Calculation: Wilshire 5000 Index divided by US GDP (Gross Domestic Product)

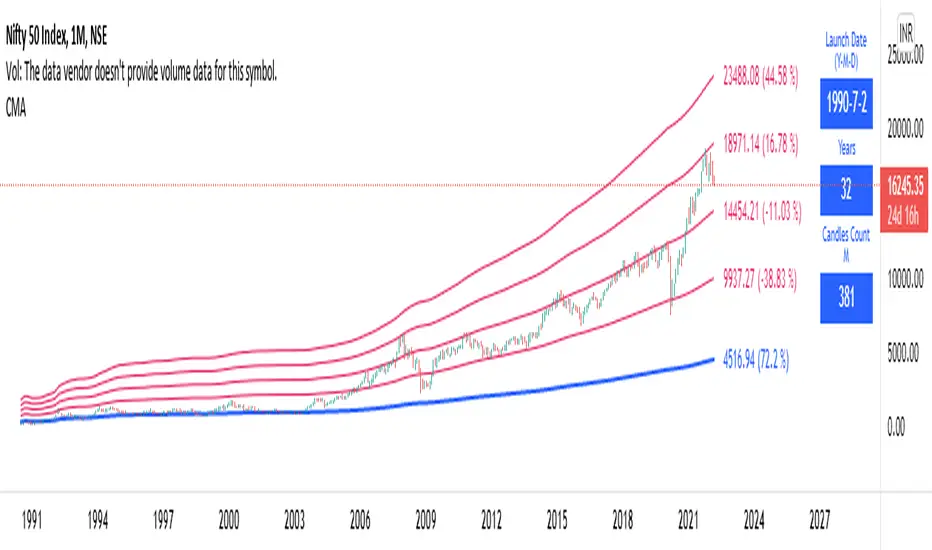
Long Term: Cumulative Moving AverageWho to use?
This indicator is for Long Term Investors or for Position trading and not for Day traders.
What time-frame to use?
• Daily, Weekly or Monthly
What is Blue line?
• Blue line is Cumulative Moving Average. It is cumulative sum of closing price.
• It is a trend reversal level.
• It is a strong support level.
• If price is below Blue line better not to take any Long position until it crosses above it.
What are Red lines?
• Red lines are Multiplier levels.
• These are target levels to exit the position.
• It can be breakout or pull back levels.
• The level combination numbers can be fully odd or even numbers.
• For example in certain stocks the working levels will be 1x, 3x, 5x etc., in others it will be even numbers like 2x, 4x, 6x etc.
• In some cases the levels need to be tweaked with custom decimals like 1.1x, 2.1x, 3.1x, 4.1x etc. to align the support & resistance levels.
How to use?
Entry
• Enter when the Price reach closer to the Blue line.
• Enter Long when the Price takes a pullback or breakout at the Red lines.
Exit
• Exit position when the Price reach closer to the Red lines in Long positions.
Indicator Menu
• Works only in higher time-frames like D, W & M.
• Will not work in Lower time-frames less than "D" or the Launch Date shows wrong in Lower time-frames.
Multipliers:
(Read above What are Red lines?)
Launch Date:
• Launch Date: Starting date of stock when it appeared in the exchange. Works only in D, W & M timeframes.
• Years: Total number of years from the Launch Date. Accurate date will be shown in Daily timeframe.
• Candles Count: Total number of candles from the Launch Date in the current timeframe.
Labels:
• First number is last traded price.
• Second number in () is percentage change from last traded price to that level.
Vwap SalvatierraVwap Salvatierra. an indicator that must be accompanied by other volume indicators.
Benefits:
- Long term Vwap.
- Middle Std. deviations, Calculated automatically.
- Previous zones available.
How to use:
when the price is >= stdev+3, look for shorts till came back to vwap
whe the price is <= stdev-3, look for longs till came back to vwap
if the vwap cannot be broken, as resistance, after several attempts, then sell
if the vwap can't be broken, like support, after several tries, then buy.

The DD investThe script tells me when to invest in the stock.
Split ur money into 3 piles. Each must be bigger than the previous one.
Buy with the first pile when the chart touches the middle line (SMA200).
Buy with the second pile when the chart touches the bottom line (lowest price of 200 weeks).
Buy with the third pile when the chart goes significantly below the bottom line (lowest price of 200 weeks).
Watch only the W1 chart (!!!).
Circles on the chart indicate places where you should buy (examples).
Consider selling half of the holding when the chart touches the top line (the highest price of 200 weeks).
Hold the rest much longer then you plan to ;)

Trend Momentum with Buyers / Sellers PowerHi there!
With this indicator, you can hunt big trends before they start.
This indicator is combined with RSI and Momentum indicators
It can show you the power of trend and which side it wants to go
It can help you to open a position at the first point of a new trend or at the safe and proven point of the trend, also it can help you to close your position before the trend change its direction (it's not recommended to use it to close your positon, but sometimes it can help you to find the ending point of big pumps)
Rules:
* Baseline is ZERO ( 0 ) line
* When gray line crossover red line, it shows us a powerful uptrend
* When the gray line crossunder the red line it shows us a powerful upward trend
Signals:
* Only use Buy signals(Long) when they are above or crossing-up baseline
* Only use Sell signals(Short) when they are under or crossing-down baseline
* If they both (red and gray lines) are too high and they suddenly starting to come back to baseline, it shows we have a range trend, the trend is weak or a reversal trend is coming!!
!! WARNING: DO NOT USE THIS INDICATOR ALONE !!
Suggestions :
-Use 1H, 4H, daily, or Weekly timeframes
-Use ADX and DI or three WMA's
-Use divergence
-You can use it for scalping but you need to change the inputs (not recommended)
If you have any idea about making new indicators(what information do you want from the chart?), comment please, then I can research and make it for all of us! =)

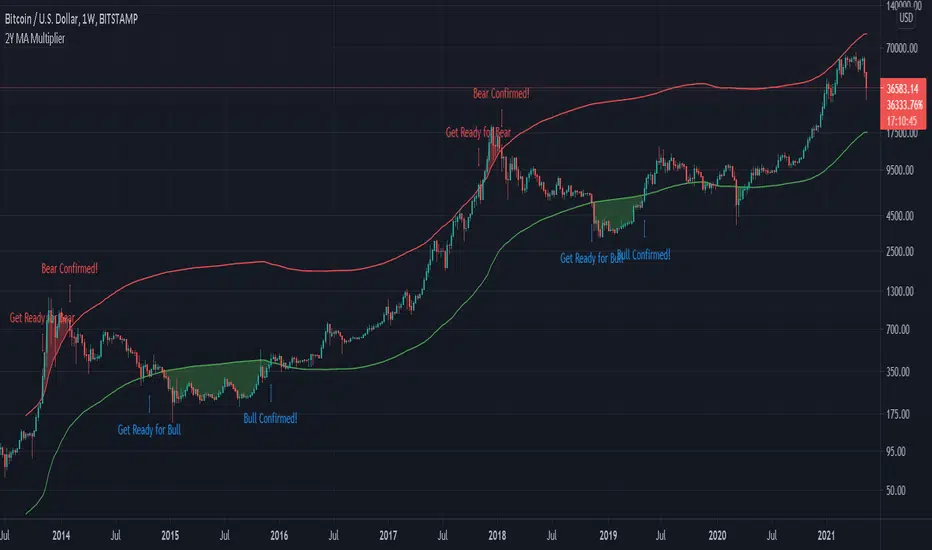
Bitcoin 2-Year MA Multiplier by GodtrixHi guys, I found this tool very useful and accurate, but can't find it on Trading View, so I made one for myself and everyone here ;)
Alert is available too.
Indicator Overview
The 2-Year MA Multiplier is intended to be used as a long term investment tool.
It highlights periods where buying or selling Bitcoin during those times would have produced outsized returns.
To do this, it uses a moving average (MA) line, the 2yr MA, and also a multiplication of that moving average line, 2yr MA x5.
Note: the x5 multiplication is of the price values of the 2yr moving average, not of its time period.
Buying Bitcoin when price drops below the 2yr MA (green line) has historically generated outsized returns. Selling Bitcoin when price goes above the 2yr MA x 5 (red line) has been historically effective for taking profit.
Why This Happens
As Bitcoin is adopted, it moves through market cycles. These are created by periods where market participants are over-excited causing the price to over-extend, and periods where they are overly pessimistic where the price over-contracts. Identifying and understanding these periods can be beneficial to the long term investor.
This tool is a simple and effective way to highlight those periods.
Credit to & Created By
Philip Swift
Date Created
July 2017
BITSTAMP:BTCUSD
Momentum Indicator avg short return minus avg long returnAverage daily return over the period 2-12 months ago minus the average daily return over the period 1-5 years ago
=> a higher return 2-12 months ago indicates a higher return in coming months according to research, because of the momentum risk factor premium
=> a higher return 1-5 years ago indicates a lower return in coming months according to research, because of the momentum risk factor premium

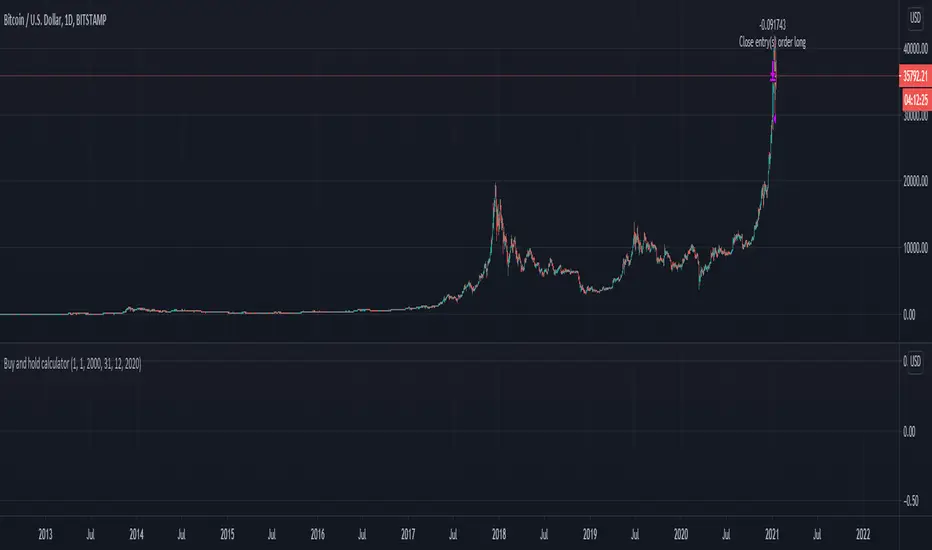
Buy and hold calculatorThis is a simple buy and hold calculator.
You have an initial date and once that dated it passed it will sell the product that was bought initially.
This strategy buys and sell 100% of the initial volume.
Buy the Dips (by Coinrule)Taking your first steps into automated trading may be challenging. Coinrule's mission is to make it as easy as possible, also for beginners.
Here follows the best trading strategy to get started with Coinrule. This strategy doesn't involve complex indicators, yet was proved to be effective in the long term for many coins. Results seem to be improved when trading a coin vs Bitcoin.
The strategy buys the dips of a coin to sell with a profit. A stop-loss protects every trade.
Crypto markets offer high volatility and, thus, excellent opportunities for trading. Excluding times of severe downtrend, buying the dip is a simple and effective long-term trading strategy. The buy-signal is set to a 2% drop in a 30-minutes time frame.
Each trade comes with a take profit and a stop loss. Both set at 2%.
You can adjust these percentages to the market volatility as an advanced setup. You can backtest the outcomes using the backtesting tool from Tradingview
The strategy assumes each order to trade 30% of the available capital. A trading fee of 0.1% is taken into account. The fee is aligned to the base fee applied on Binance, which is the largest cryptocurrency exchange.
