PROTECTED SOURCE SCRIPT
已更新 4-EMA Trend
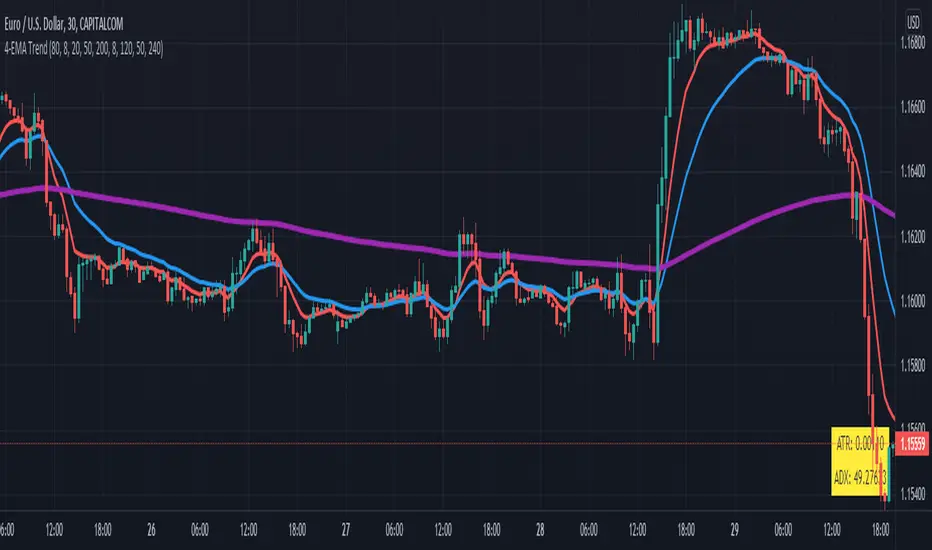
This indicator can be used to visualize when price is above or below special exponential moving averages (8, 21, 50 and 200) that are also displayed on the chart. A green or red background is plotted then, that can be followed as a trend. You can define the amount of risk (e.g. in $) and the number of previous bars that will be used to calculate the stop loss. For the stop loss a label is shown (long or short) that displays the quantity to buy or sell for your defined risk. It is recommend to use the indicator in combination with my Stochastic & RSI (see chart) to enter trades long or short when stochastic is overbought or oversold and RSI above or below 50.
 US100
US100
發行說明
Update trend indication: ema8 has to be above / below slower ema發行說明
EMA description and length adjusted發行說明
Show stop loss buy or sell depending price above or below slowest EMA發行說明
SMA 40 added as special pullback indicator發行說明
Added alerts for long or short trend change發行說明
Add MTF support for slow EMAs發行說明
SMA replaced by EMA for trend detection發行說明
Length of EMAs can be set發行說明
MTF EMA not displayed by default, 20, 50, 200 ema default length發行說明
ATR Stop added as dots (bullish, bearish)發行說明
Input option for ema fast and middle length發行說明
EMA Ribbon added with option to hide it發行說明
Alert when price is close to trend EMA (default 200 EMA)發行說明
Performance improved, ema ribbon removed發行說明
TEMA for trend included發行說明
TEMA with custom length, pine version 5發行說明
Refactoring and 4th ema added發行說明
ATR stoploss multiplier added發行說明
Added real price display for Heikin Ashi chart type發行說明
Labels for engulfing candles added發行說明
Engulfing pattern bug fixed發行說明
Barcolor for engulfing added發行說明
Engulging candles added and atr to 10發行說明
Volatility Stop Length added發行說明
Inside bar added as candlestick pattern發行說明
Inside bar without color受保護腳本
此腳本以閉源形式發佈。 不過,您可以自由使用,沒有任何限制 — 點擊此處了解更多。
Access our indicators from: indivisionx.com
免責聲明
這些資訊和出版物並非旨在提供,也不構成TradingView提供或認可的任何形式的財務、投資、交易或其他類型的建議或推薦。請閱讀使用條款以了解更多資訊。
受保護腳本
此腳本以閉源形式發佈。 不過,您可以自由使用,沒有任何限制 — 點擊此處了解更多。
Access our indicators from: indivisionx.com
免責聲明
這些資訊和出版物並非旨在提供,也不構成TradingView提供或認可的任何形式的財務、投資、交易或其他類型的建議或推薦。請閱讀使用條款以了解更多資訊。