OPEN-SOURCE SCRIPT
已更新 Trend lines
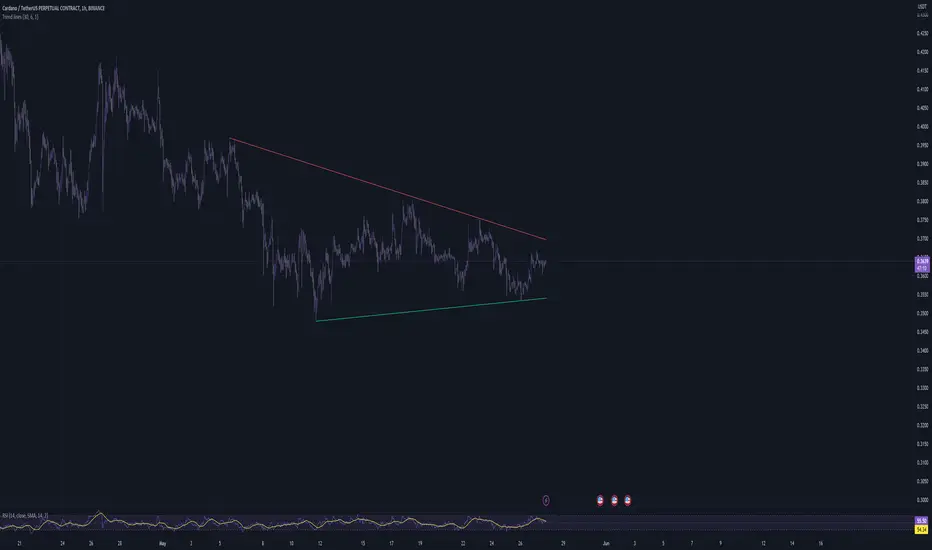
This script aims to identify and plot trend lines and pivot points on a price chart, with the aim of facilitating technical analysis for trading.
The script allows users to configure a number of parameters including the period for Pivot Points, the maximum number of pivots, and the maximum number of trend lines.
Pivot points (local highs and lows in the price data) are identified using TradingView's built-in pivot high and pivot low functions. The identified pivot points are then stored in arrays. The script also optionally plots these points on the chart.
The main goal of the script is to find and plot trend lines based on the pivot points. For each pair of pivot points, it computes the slope of the line connecting them. If all the other pivot points are below this line (for downward trends) or above this line (for upward trends), the line is considered a valid trend line.
The script also includes a feature that suggests potential "buy" or "sell" points along the trend lines. When the price touches the trend line, a label indicating a potential trading action (buy or sell) is created on the chart.
發行說明
fixed a problem where the line crosses the price and doesnt dissapear. 發行說明
changed reference image發行說明
changes to make it a little bit faster發行說明
- removed signals because this indicator does not need them- updated logic
- added different colors for lines
開源腳本
秉持TradingView一貫精神,這個腳本的創作者將其設為開源,以便交易者檢視並驗證其功能。向作者致敬!您可以免費使用此腳本,但請注意,重新發佈代碼需遵守我們的社群規範。
免責聲明
這些資訊和出版物並非旨在提供,也不構成TradingView提供或認可的任何形式的財務、投資、交易或其他類型的建議或推薦。請閱讀使用條款以了解更多資訊。
免責聲明
這些資訊和出版物並非旨在提供,也不構成TradingView提供或認可的任何形式的財務、投資、交易或其他類型的建議或推薦。請閱讀使用條款以了解更多資訊。